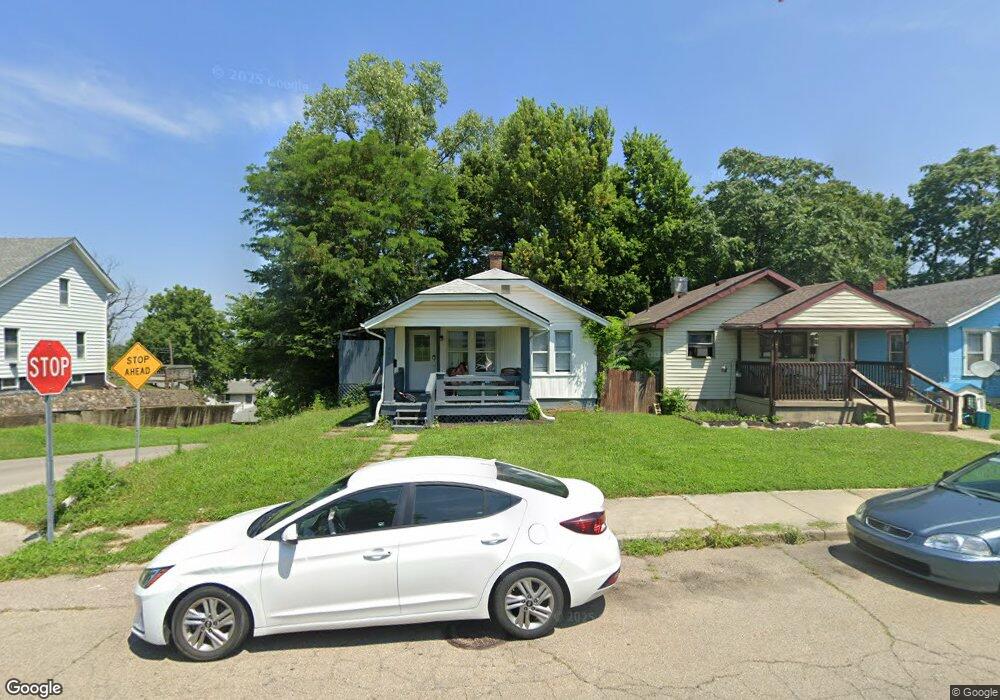
503 Sheridan Ave Dayton, OH 45403
Burkhardt NeighborhoodEstimated Value: $76,698 - $84,000
2
Beds
1
Bath
772
Sq Ft
$106/Sq Ft
Est. Value
About This Home
This home is located at 503 Sheridan Ave, Dayton, OH 45403 and is currently estimated at $81,675, approximately $105 per square foot. 503 Sheridan Ave is a home located in Montgomery County with nearby schools including Ruskin Elementary School, Kiser Elementary, and Horizon Science Academy Dayton Downtown.
Ownership History
Date
Name
Owned For
Owner Type
Purchase Details
Closed on
Jun 25, 2024
Sold by
Lauther Michael R and Lauther Mohanie
Bought by
Dz Dreams Llc
Current Estimated Value
Home Financials for this Owner
Home Financials are based on the most recent Mortgage that was taken out on this home.
Original Mortgage
$59,200
Outstanding Balance
$58,446
Interest Rate
7.03%
Mortgage Type
New Conventional
Estimated Equity
$23,229
Purchase Details
Closed on
Nov 8, 2018
Sold by
Equity Trust Co
Bought by
Lauther Michael R
Purchase Details
Closed on
Jan 10, 2011
Sold by
Norvell Anthony W and Norvell Pamela M
Bought by
Equity Trust Company
Purchase Details
Closed on
Mar 9, 2005
Sold by
Norvell Anthony W and Norvell Tony
Bought by
Norvell Anthony W and Norvell Pamela M
Home Financials for this Owner
Home Financials are based on the most recent Mortgage that was taken out on this home.
Original Mortgage
$31,700
Interest Rate
5.7%
Mortgage Type
New Conventional
Purchase Details
Closed on
Apr 10, 1998
Sold by
Dixon Fraker Ruby
Bought by
Norvell Tony
Create a Home Valuation Report for This Property
The Home Valuation Report is an in-depth analysis detailing your home's value as well as a comparison with similar homes in the area
Home Values in the Area
Average Home Value in this Area
Purchase History
| Date | Buyer | Sale Price | Title Company |
|---|---|---|---|
| Dz Dreams Llc | $72,500 | Home Services Title | |
| Lauther Michael R | -- | None Available | |
| Equity Trust Company | -- | None Available | |
| Norvell Anthony W | -- | None Available | |
| Norvell Tony | $26,000 | -- | |
| Norvell Tony | $26,000 | -- |
Source: Public Records
Mortgage History
| Date | Status | Borrower | Loan Amount |
|---|---|---|---|
| Open | Dz Dreams Llc | $59,200 | |
| Previous Owner | Norvell Anthony W | $31,700 |
Source: Public Records
Tax History Compared to Growth
Tax History
| Year | Tax Paid | Tax Assessment Tax Assessment Total Assessment is a certain percentage of the fair market value that is determined by local assessors to be the total taxable value of land and additions on the property. | Land | Improvement |
|---|---|---|---|---|
| 2024 | $931 | $15,940 | $3,340 | $12,600 |
| 2023 | $931 | $15,940 | $3,340 | $12,600 |
| 2022 | $803 | $10,580 | $2,210 | $8,370 |
| 2021 | $798 | $10,580 | $2,210 | $8,370 |
| 2020 | $797 | $10,580 | $2,210 | $8,370 |
| 2019 | $873 | $10,420 | $2,940 | $7,480 |
| 2018 | $852 | $10,420 | $2,940 | $7,480 |
| 2017 | $845 | $10,420 | $2,940 | $7,480 |
| 2016 | $826 | $9,670 | $2,940 | $6,730 |
| 2015 | $782 | $9,670 | $2,940 | $6,730 |
| 2014 | $782 | $9,670 | $2,940 | $6,730 |
| 2012 | -- | $13,210 | $2,940 | $10,270 |
Source: Public Records
Map
Nearby Homes
- 223 Pleasant Ave
- 161 S Harbine Ave
- 153 S Hedges St
- 1323 Huffman Ave
- 40 Klee Ave
- 2929 E 5th St
- 111 S Hedges St
- 3007 E 4th St
- 2821 E 5th St Unit 2819
- 240 Bierce Ave
- 755 Huffman Ave
- 101 S Delmar Ave
- 227 Livingston Ave Unit 225
- 2103 E 4th St
- 631 Greenlawn Ave
- 639 Huffman Ave
- 515 Heiss Ave Unit 515-517
- 102 S Findlay St
- 115 Oaklawn Ave
- 800 Linden Ave
- 507 Sheridan Ave
- 511 Sheridan Ave
- 515 Sheridan Ave
- 517 Sheridan Ave
- 303 S Hedges St
- 512 Burkhardt Ave
- 500 Sheridan Ave
- 506 Sheridan Ave
- 428 Sheridan Ave
- 417 Sheridan Ave
- 424 Burkhardt Ave
- 527 Sheridan Ave
- 424 Sheridan Ave
- 512 Sheridan Ave
- 420 Burkhardt Ave
- 413 Sheridan Ave
- 516 Sheridan Ave
- 420 Sheridan Ave
- 531 Sheridan Ave
- 416 Burkhardt Ave