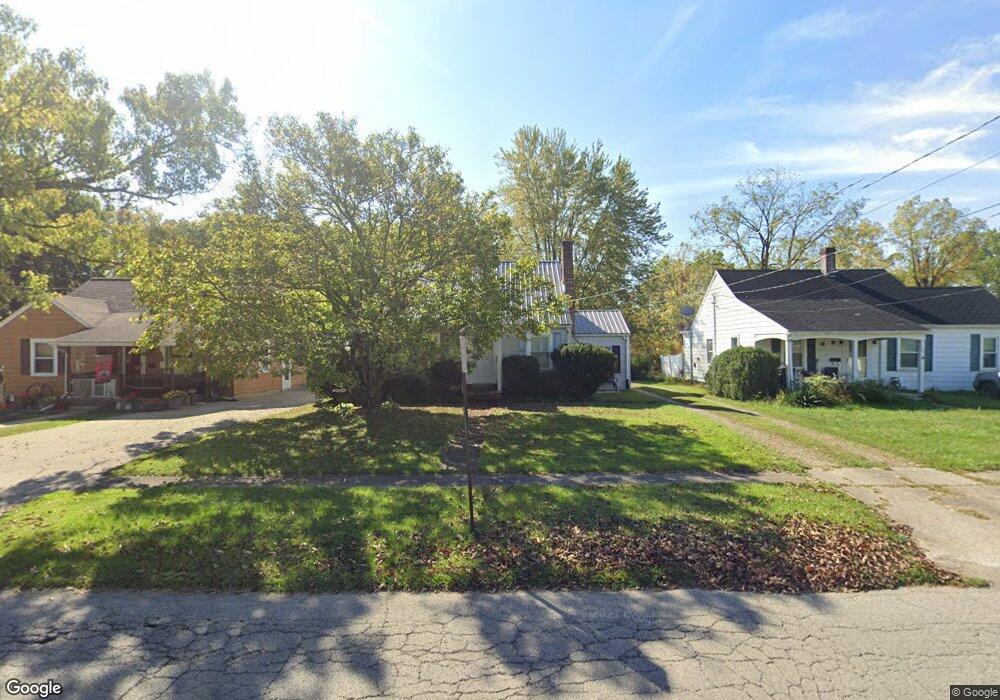
503 Sherman St Galion, OH 44833
Estimated Value: $116,867 - $147,000
2
Beds
1
Bath
1,000
Sq Ft
$130/Sq Ft
Est. Value
About This Home
This home is located at 503 Sherman St, Galion, OH 44833 and is currently estimated at $130,467, approximately $130 per square foot. 503 Sherman St is a home located in Crawford County with nearby schools including Galion Primary School, Galion Intermediate School, and Galion Middle School.
Ownership History
Date
Name
Owned For
Owner Type
Purchase Details
Closed on
Jul 10, 2018
Sold by
Faeth Kevin R
Bought by
Clark William D
Current Estimated Value
Home Financials for this Owner
Home Financials are based on the most recent Mortgage that was taken out on this home.
Original Mortgage
$55,100
Outstanding Balance
$47,858
Interest Rate
4.6%
Mortgage Type
New Conventional
Estimated Equity
$82,609
Purchase Details
Closed on
Mar 9, 2011
Sold by
Pfahler Evelyn E
Bought by
Faeth Richard F
Create a Home Valuation Report for This Property
The Home Valuation Report is an in-depth analysis detailing your home's value as well as a comparison with similar homes in the area
Home Values in the Area
Average Home Value in this Area
Purchase History
| Date | Buyer | Sale Price | Title Company |
|---|---|---|---|
| Clark William D | $29,000 | None Available | |
| Clark William D | $29,000 | None Available | |
| Faeth Richard F | $23,400 | None Available |
Source: Public Records
Mortgage History
| Date | Status | Borrower | Loan Amount |
|---|---|---|---|
| Open | Clark William D | $55,100 |
Source: Public Records
Tax History Compared to Growth
Tax History
| Year | Tax Paid | Tax Assessment Tax Assessment Total Assessment is a certain percentage of the fair market value that is determined by local assessors to be the total taxable value of land and additions on the property. | Land | Improvement |
|---|---|---|---|---|
| 2024 | $1,027 | $29,050 | $2,800 | $26,250 |
| 2023 | $1,027 | $13,530 | $2,000 | $11,530 |
| 2022 | $611 | $13,530 | $2,000 | $11,530 |
| 2021 | $626 | $13,530 | $2,000 | $11,530 |
| 2020 | $618 | $13,010 | $2,000 | $11,010 |
| 2019 | $633 | $12,940 | $2,000 | $10,940 |
| 2018 | $632 | $12,940 | $2,000 | $10,940 |
| 2017 | $661 | $12,990 | $2,000 | $10,990 |
| 2016 | $638 | $12,990 | $2,000 | $10,990 |
| 2015 | $637 | $12,990 | $2,000 | $10,990 |
| 2014 | $650 | $12,990 | $2,000 | $10,990 |
| 2013 | $650 | $12,990 | $2,000 | $10,990 |
Source: Public Records
Map
Nearby Homes