Estimated Value: $376,098 - $419,000
3
Beds
2
Baths
1,516
Sq Ft
$260/Sq Ft
Est. Value
About This Home
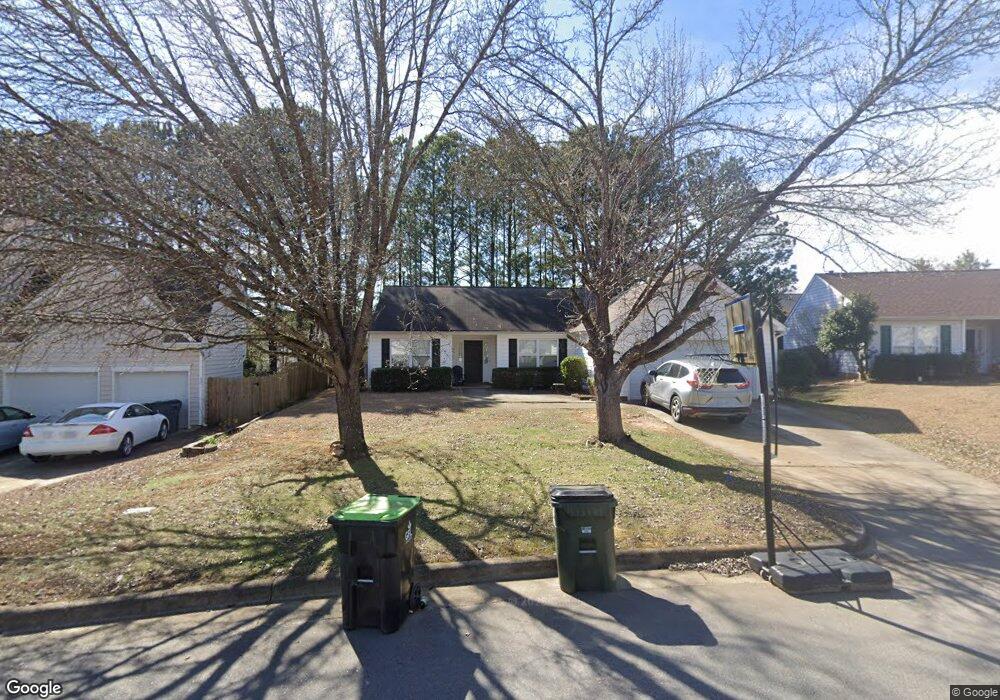
This home is located at 503 Stonecreek Dr, Apex, NC 27539 and is currently estimated at $394,275, approximately $260 per square foot. 503 Stonecreek Dr is a home located in Wake County with nearby schools including Lufkin Road Middle School, Apex Friendship High School, and Pine Springs Prep Academy.
Ownership History
Date
Name
Owned For
Owner Type
Purchase Details
Closed on
May 20, 2009
Sold by
Lu Trang Diep and Ng Wai Lin
Bought by
Moore Matthew D and Moore Hannah
Current Estimated Value
Home Financials for this Owner
Home Financials are based on the most recent Mortgage that was taken out on this home.
Original Mortgage
$166,920
Outstanding Balance
$105,691
Interest Rate
4.89%
Mortgage Type
FHA
Estimated Equity
$288,584
Purchase Details
Closed on
Jul 30, 2002
Sold by
Kang Michael Y and Kang Eun S
Bought by
Lu Trang Diep and Ng Wai Lin
Home Financials for this Owner
Home Financials are based on the most recent Mortgage that was taken out on this home.
Original Mortgage
$113,600
Interest Rate
6.67%
Purchase Details
Closed on
Sep 28, 2000
Sold by
D R Horton Inc Torrey
Bought by
King Michael Y and King Eun S
Home Financials for this Owner
Home Financials are based on the most recent Mortgage that was taken out on this home.
Original Mortgage
$114,200
Interest Rate
7.67%
Create a Home Valuation Report for This Property
The Home Valuation Report is an in-depth analysis detailing your home's value as well as a comparison with similar homes in the area
Home Values in the Area
Average Home Value in this Area
Purchase History
| Date | Buyer | Sale Price | Title Company |
|---|---|---|---|
| Moore Matthew D | $170,000 | None Available | |
| Lu Trang Diep | $142,000 | -- | |
| King Michael Y | $143,000 | -- |
Source: Public Records
Mortgage History
| Date | Status | Borrower | Loan Amount |
|---|---|---|---|
| Open | Moore Matthew D | $166,920 | |
| Previous Owner | Lu Trang Diep | $113,600 | |
| Previous Owner | King Michael Y | $114,200 |
Source: Public Records
Tax History Compared to Growth
Tax History
| Year | Tax Paid | Tax Assessment Tax Assessment Total Assessment is a certain percentage of the fair market value that is determined by local assessors to be the total taxable value of land and additions on the property. | Land | Improvement |
|---|---|---|---|---|
| 2025 | $3,130 | $356,250 | $160,000 | $196,250 |
| 2024 | $3,061 | $356,250 | $160,000 | $196,250 |
| 2023 | $2,672 | $241,755 | $70,000 | $171,755 |
| 2022 | $2,509 | $241,755 | $70,000 | $171,755 |
| 2021 | $2,413 | $241,755 | $70,000 | $171,755 |
| 2020 | $2,389 | $241,755 | $70,000 | $171,755 |
| 2019 | $2,206 | $192,514 | $62,000 | $130,514 |
| 2018 | $2,079 | $192,514 | $62,000 | $130,514 |
| 2017 | $1,936 | $192,514 | $62,000 | $130,514 |
| 2016 | $1,908 | $192,514 | $62,000 | $130,514 |
| 2015 | $1,765 | $173,742 | $42,000 | $131,742 |
| 2014 | -- | $173,742 | $42,000 | $131,742 |
Source: Public Records
Map
Nearby Homes
- 102 Spring Dove Ln
- 314 Cabana Dr
- 108 Bella Place
- 5712 Mosley Ave
- 300 Firefly Rd
- 148 Danesway Dr
- 201 Adefield Ln
- 5828 Old Smithfield Rd
- 317 Commons Dr
- 413 Hyannis Dr
- 201 Holmby Ct
- 3332 Colby Chase Dr Unit Lot 3
- 3340 Colby Chase Dr Unit Lot 2
- 680 Wickham Ridge Rd
- 105 Arbor Wynds Ct
- 825 Wickham Ridge Rd
- 5417 Bobbitt Rd
- 3906 Mc Clain St
- 1539 N Main St
- 212 Mystic Pine Place
- 505 Stonecreek Dr
- 501 Stonecreek Dr
- 102 Sunshine Crest Ct
- 104 Sunshine Crest Ct
- 108 Sunshine Crest Ct
- 100 Sunshine Crest Ct
- 507 Stonecreek Dr
- 110 Sunshine Crest Ct
- 504 Stonecreek Dr
- 112 Sunshine Crest Ct
- 500 Stonecreek Dr
- 999 Stone Creek Road Lot 3
- 411 Stonecreek Dr
- 200 Sunshine Crest Ct
- 508 Stonecreek Dr
- 509 Stonecreek Dr
- 213 Thorncrest Dr
- 412 Stonecreek Dr
- 105 Sunshine Crest Ct
- 103 Sunshine Crest Ct