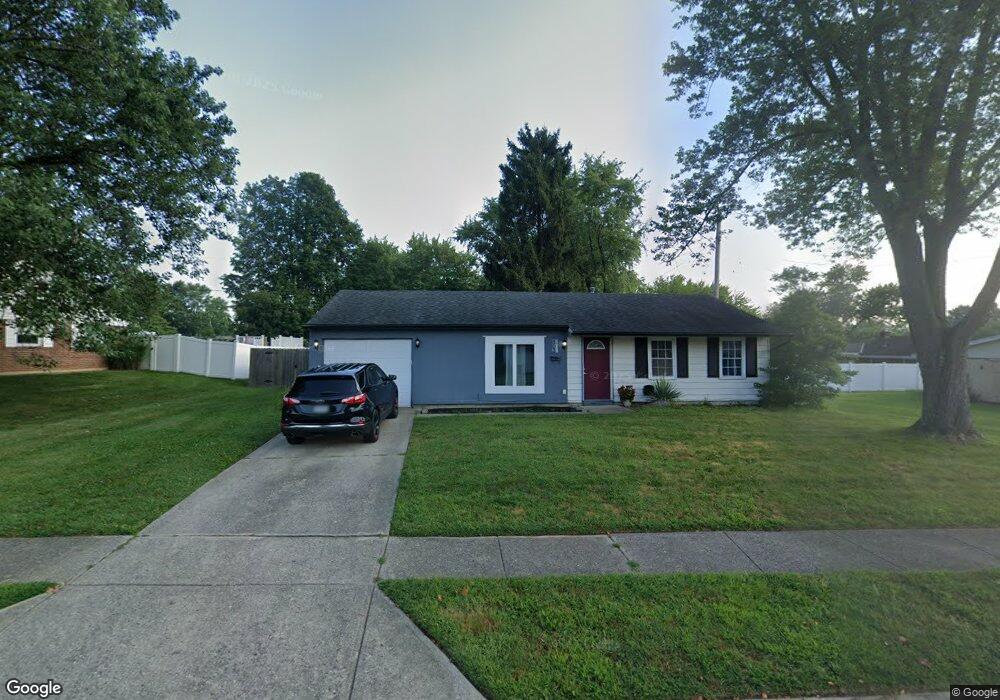
503 Unger Ave Englewood, OH 45322
Estimated Value: $168,000 - $185,000
3
Beds
1
Bath
1,102
Sq Ft
$162/Sq Ft
Est. Value
About This Home
This home is located at 503 Unger Ave, Englewood, OH 45322 and is currently estimated at $178,490, approximately $161 per square foot. 503 Unger Ave is a home located in Montgomery County with nearby schools including Northmont High School, Trotwood Preparatory & Fitness Academy, and Imagine Schools - Woodbury Academy.
Ownership History
Date
Name
Owned For
Owner Type
Purchase Details
Closed on
Mar 31, 2020
Sold by
Saleh Rafat
Bought by
Bolanger Brittany Anne and Molnar Todd Michael
Current Estimated Value
Home Financials for this Owner
Home Financials are based on the most recent Mortgage that was taken out on this home.
Original Mortgage
$120,000
Outstanding Balance
$106,305
Interest Rate
3.4%
Mortgage Type
VA
Estimated Equity
$72,185
Purchase Details
Closed on
Feb 11, 2020
Sold by
Quinn Nicole L and Mycumortgage Llc
Bought by
Saleh Rafat
Home Financials for this Owner
Home Financials are based on the most recent Mortgage that was taken out on this home.
Original Mortgage
$120,000
Outstanding Balance
$106,305
Interest Rate
3.4%
Mortgage Type
VA
Estimated Equity
$72,185
Purchase Details
Closed on
Jul 30, 2003
Sold by
Frost John W and Frost Mary K
Bought by
Tucker Darin C
Home Financials for this Owner
Home Financials are based on the most recent Mortgage that was taken out on this home.
Original Mortgage
$91,179
Interest Rate
5.3%
Mortgage Type
FHA
Create a Home Valuation Report for This Property
The Home Valuation Report is an in-depth analysis detailing your home's value as well as a comparison with similar homes in the area
Home Values in the Area
Average Home Value in this Area
Purchase History
| Date | Buyer | Sale Price | Title Company |
|---|---|---|---|
| Bolanger Brittany Anne | $120,000 | Partners Land Title Agency | |
| Saleh Rafat | $66,220 | None Available | |
| Tucker Darin C | $91,900 | -- |
Source: Public Records
Mortgage History
| Date | Status | Borrower | Loan Amount |
|---|---|---|---|
| Open | Bolanger Brittany Anne | $120,000 | |
| Previous Owner | Tucker Darin C | $91,179 |
Source: Public Records
Tax History Compared to Growth
Tax History
| Year | Tax Paid | Tax Assessment Tax Assessment Total Assessment is a certain percentage of the fair market value that is determined by local assessors to be the total taxable value of land and additions on the property. | Land | Improvement |
|---|---|---|---|---|
| 2024 | $2,446 | $42,780 | $9,930 | $32,850 |
| 2023 | $2,446 | $42,780 | $9,930 | $32,850 |
| 2022 | $2,236 | $30,080 | $6,990 | $23,090 |
| 2021 | $2,242 | $30,080 | $6,990 | $23,090 |
| 2020 | $2,200 | $30,080 | $6,990 | $23,090 |
| 2019 | $1,945 | $23,800 | $8,040 | $15,760 |
| 2018 | $1,910 | $23,800 | $8,040 | $15,760 |
| 2017 | $1,897 | $23,800 | $8,040 | $15,760 |
| 2016 | $1,850 | $22,810 | $6,990 | $15,820 |
| 2015 | $1,692 | $22,810 | $6,990 | $15,820 |
| 2014 | $1,692 | $22,810 | $6,990 | $15,820 |
| 2012 | -- | $28,600 | $7,750 | $20,850 |
Source: Public Records
Map
Nearby Homes
- 510 Rohr Ln
- 803 Albert St
- 206 Lodestone Dr
- 510 Lambert Ln
- 800 Sipos Cir
- 534 Unger Ave
- 717 Woodlawn Ave
- 104 Silverstone Dr
- 505 Durst Dr
- 109 Silverstone Dr
- 1010 Heathwood Dr
- 607 Albert St
- 718 Bonnycastle Ave
- 206 Gardengrove Way
- 108 Tate Ave
- 108 Denwood Trail
- 1017 Terracewood Dr
- 830 W Wenger Rd
- 208 S Walnut St
- 306 Pauly Dr