503 W 1120 N Orem, UT 84057
Bonneville NeighborhoodEstimated Value: $564,000 - $570,000
5
Beds
2
Baths
2,532
Sq Ft
$224/Sq Ft
Est. Value
About This Home
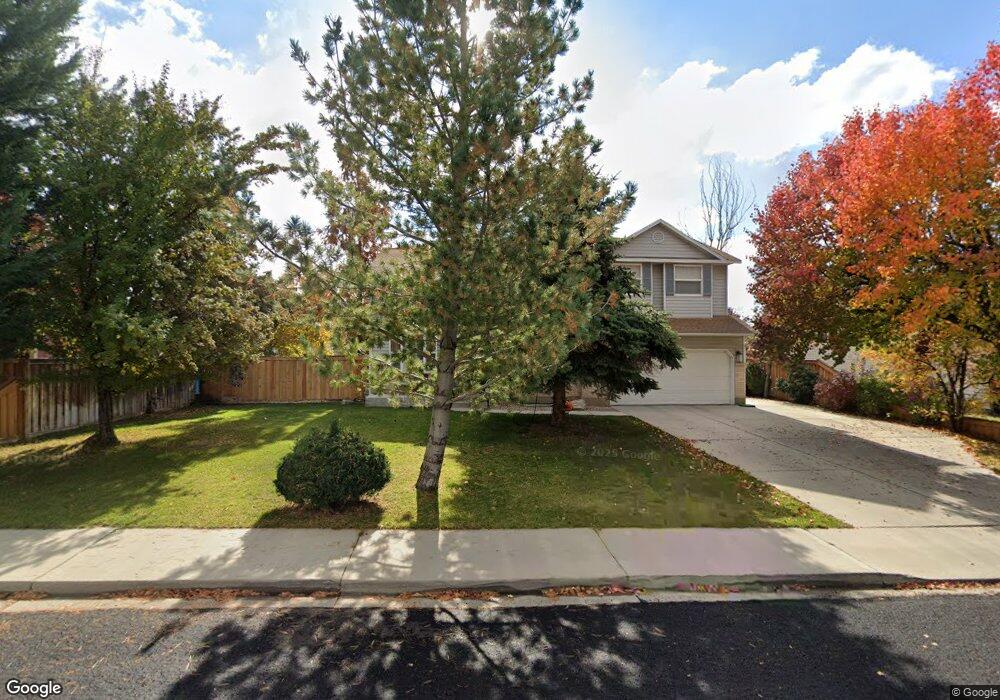
This home is located at 503 W 1120 N, Orem, UT 84057 and is currently estimated at $566,586, approximately $223 per square foot. 503 W 1120 N is a home located in Utah County with nearby schools including Bonneville Elementary School, Orem Junior High School, and Timpanogos High School.
Ownership History
Date
Name
Owned For
Owner Type
Purchase Details
Closed on
May 26, 2020
Sold by
Sickles Andrew
Bought by
Rangel America
Current Estimated Value
Home Financials for this Owner
Home Financials are based on the most recent Mortgage that was taken out on this home.
Original Mortgage
$289,750
Outstanding Balance
$257,320
Interest Rate
3.3%
Mortgage Type
New Conventional
Estimated Equity
$309,266
Purchase Details
Closed on
Feb 20, 2015
Sold by
Smith Michael Bradley and Smith Karmen H
Bought by
Sickles Andrew
Home Financials for this Owner
Home Financials are based on the most recent Mortgage that was taken out on this home.
Original Mortgage
$213,560
Interest Rate
3.82%
Mortgage Type
FHA
Purchase Details
Closed on
Oct 16, 1996
Sold by
Coon Laurie H
Bought by
Smith Karmen H
Create a Home Valuation Report for This Property
The Home Valuation Report is an in-depth analysis detailing your home's value as well as a comparison with similar homes in the area
Home Values in the Area
Average Home Value in this Area
Purchase History
| Date | Buyer | Sale Price | Title Company |
|---|---|---|---|
| Rangel America | -- | Eagle Pointe Ttl Ins Agcy In | |
| Sickles Andrew | -- | Provo Land Title Co | |
| Smith Karmen H | -- | First American Title |
Source: Public Records
Mortgage History
| Date | Status | Borrower | Loan Amount |
|---|---|---|---|
| Open | Rangel America | $289,750 | |
| Previous Owner | Sickles Andrew | $213,560 |
Source: Public Records
Tax History Compared to Growth
Tax History
| Year | Tax Paid | Tax Assessment Tax Assessment Total Assessment is a certain percentage of the fair market value that is determined by local assessors to be the total taxable value of land and additions on the property. | Land | Improvement |
|---|---|---|---|---|
| 2025 | $2,096 | $279,180 | $194,100 | $313,500 |
| 2024 | $2,096 | $256,300 | $0 | $0 |
| 2023 | $1,967 | $258,445 | $0 | $0 |
| 2022 | $1,932 | $245,960 | $0 | $0 |
| 2021 | $1,799 | $347,000 | $151,600 | $195,400 |
| 2020 | $1,651 | $312,900 | $121,300 | $191,600 |
| 2019 | $1,524 | $300,400 | $121,300 | $179,100 |
| 2018 | $1,488 | $280,200 | $110,900 | $169,300 |
| 2017 | $1,422 | $143,495 | $0 | $0 |
| 2016 | $1,430 | $133,045 | $0 | $0 |
| 2015 | $1,424 | $125,290 | $0 | $0 |
| 2014 | -- | $122,210 | $0 | $0 |
Source: Public Records
Map
Nearby Homes
- 545 W 1240 N
- 582 W 1300 N
- 597 W 1400 N
- 332 W Amiron Way Unit D
- 1455 N Amiron Way Unit A
- 947 N 830 W
- 417 W 750 N
- 1050 N 100 W
- 145 W 905 N
- 613 W 1550 N
- 1060 N 100 W
- 933 N 900 W
- 125 W 870 N
- 677 N Orem Blvd Unit 28
- 999 W 1100 N
- 1561 N 740 W
- 1018 N 985 W Unit 516
- 1527 N 275 St W Unit 4
- 1543 N 275 St W Unit 2
- 1531 N 275 St W Unit 3