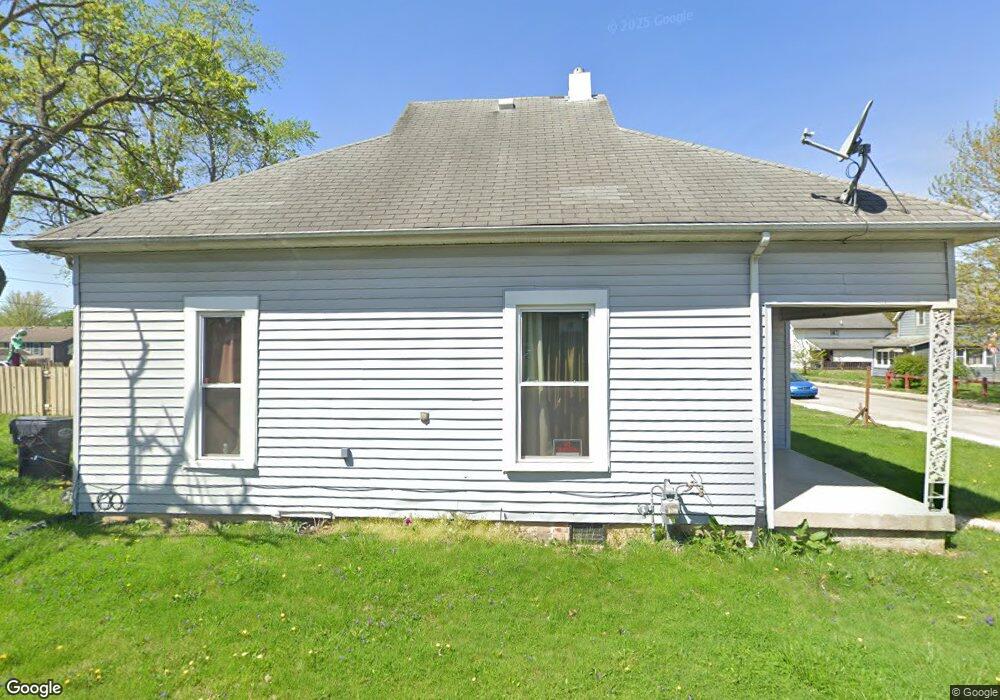
503 W 4th St Anderson, IN 46016
Estimated Value: $66,000 - $88,000
2
Beds
1
Bath
1,069
Sq Ft
$71/Sq Ft
Est. Value
About This Home
This home is located at 503 W 4th St, Anderson, IN 46016 and is currently estimated at $75,814, approximately $70 per square foot. 503 W 4th St is a home located in Madison County with nearby schools including Eastside Elementary School, Highland Middle School, and Anderson High School.
Ownership History
Date
Name
Owned For
Owner Type
Purchase Details
Closed on
Sep 24, 2013
Sold by
Madison County Auditor
Bought by
Finvest Llc
Current Estimated Value
Purchase Details
Closed on
Jul 7, 2005
Sold by
Muterspaugh William C and Muterspaugh Peggy Mae
Bought by
Huston Barry L
Home Financials for this Owner
Home Financials are based on the most recent Mortgage that was taken out on this home.
Original Mortgage
$34,000
Interest Rate
11.67%
Mortgage Type
Adjustable Rate Mortgage/ARM
Create a Home Valuation Report for This Property
The Home Valuation Report is an in-depth analysis detailing your home's value as well as a comparison with similar homes in the area
Home Values in the Area
Average Home Value in this Area
Purchase History
| Date | Buyer | Sale Price | Title Company |
|---|---|---|---|
| Finvest Llc | $1,803 | -- | |
| Huston Barry L | -- | -- |
Source: Public Records
Mortgage History
| Date | Status | Borrower | Loan Amount |
|---|---|---|---|
| Previous Owner | Huston Barry L | $34,000 |
Source: Public Records
Tax History Compared to Growth
Tax History
| Year | Tax Paid | Tax Assessment Tax Assessment Total Assessment is a certain percentage of the fair market value that is determined by local assessors to be the total taxable value of land and additions on the property. | Land | Improvement |
|---|---|---|---|---|
| 2024 | $742 | $33,400 | $6,400 | $27,000 |
| 2023 | $689 | $30,800 | $6,100 | $24,700 |
| 2022 | $673 | $30,100 | $5,700 | $24,400 |
| 2021 | $626 | $27,800 | $5,700 | $22,100 |
| 2020 | $596 | $26,400 | $5,400 | $21,000 |
| 2019 | $584 | $25,800 | $5,400 | $20,400 |
| 2018 | $556 | $24,100 | $5,400 | $18,700 |
| 2017 | $476 | $23,800 | $5,400 | $18,400 |
| 2016 | $476 | $23,800 | $5,400 | $18,400 |
| 2014 | $486 | $24,300 | $5,500 | $18,800 |
| 2013 | $486 | $24,300 | $5,500 | $18,800 |
Source: Public Records
Map
Nearby Homes