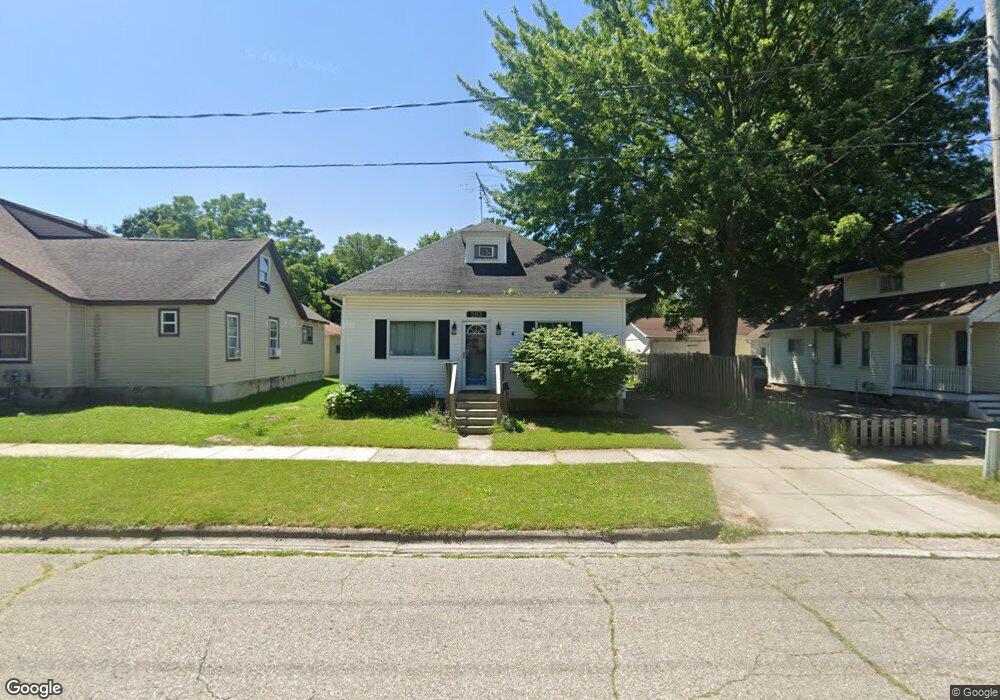
503 W Higham St St Update, MI 48879
Estimated Value: $132,000 - $174,389
3
Beds
1
Bath
936
Sq Ft
$161/Sq Ft
Est. Value
About This Home
This home is located at 503 W Higham St St, Update, MI 48879 and is currently estimated at $150,597, approximately $160 per square foot. 503 W Higham St St is a home located in Clinton County with nearby schools including St. Johns High School and St Joseph Catholic School.
Ownership History
Date
Name
Owned For
Owner Type
Purchase Details
Closed on
Oct 19, 2018
Sold by
Schneider Peggy
Bought by
Schneider Scott and Schneider Kendra
Current Estimated Value
Purchase Details
Closed on
Nov 3, 2017
Sold by
Mills Audrea
Bought by
Schneider Peggy
Purchase Details
Closed on
Apr 28, 2015
Sold by
Daniels Joanne
Bought by
Schneider Peggy and Mills Audrea
Purchase Details
Closed on
Aug 20, 2014
Sold by
Schneider Amanda
Bought by
Jpmorgan Chase Bank Na
Purchase Details
Closed on
Mar 13, 2003
Sold by
Neller Jack Edward
Bought by
Household Finance Corp Iii
Create a Home Valuation Report for This Property
The Home Valuation Report is an in-depth analysis detailing your home's value as well as a comparison with similar homes in the area
Home Values in the Area
Average Home Value in this Area
Purchase History
| Date | Buyer | Sale Price | Title Company |
|---|---|---|---|
| Schneider Scott | $55,000 | None Available | |
| Schneider Peggy | -- | None Available | |
| Schneider Peggy | -- | Fa | |
| Daniels Joanne | $35,000 | Diversified National Title | |
| Jpmorgan Chase Bank Na | $32,300 | None Available | |
| Household Finance Corp Iii | $107,630 | -- |
Source: Public Records
Tax History Compared to Growth
Tax History
| Year | Tax Paid | Tax Assessment Tax Assessment Total Assessment is a certain percentage of the fair market value that is determined by local assessors to be the total taxable value of land and additions on the property. | Land | Improvement |
|---|---|---|---|---|
| 2025 | $2,063 | $67,500 | $13,000 | $54,500 |
| 2024 | $1,446 | $64,100 | $13,000 | $51,100 |
| 2023 | $1,364 | $59,700 | $0 | $0 |
| 2022 | $1,862 | $53,500 | $11,300 | $42,200 |
| 2021 | $1,813 | $49,800 | $9,700 | $40,100 |
| 2020 | $1,750 | $47,200 | $8,900 | $38,300 |
| 2019 | $1,701 | $41,000 | $8,900 | $32,100 |
| 2018 | $2,273 | $39,000 | $8,900 | $30,100 |
| 2017 | -- | $40,100 | $8,900 | $31,200 |
| 2016 | -- | $38,000 | $7,400 | $30,600 |
| 2015 | -- | $34,900 | $0 | $0 |
| 2011 | -- | $36,400 | $0 | $0 |
Source: Public Records
Map
Nearby Homes
- 111 N Ottawa St
- 504 Vauconsant St
- 800 W State St
- 306 S Emmons St
- 608 N Morton St
- 709 Garfield St
- 823 N Lansing St
- 408 S Prospect St
- 606 W Gibbs St
- 304 W Gibbs St
- 715 N Clinton Ave
- 301 E Walker St
- 1455 W Hyde Rd
- 112 W Gibbs St
- 511 S Church St
- 501 S Clinton Ave
- 812 W Park St
- 504 E State St
- 204 N Whittemore St
- 606 E Railroad St
- 505 W Higham St
- 501 W Higham St
- 507 W Higham St
- 205 N Prospect St
- 504 W Walker St St
- 504 W Walker St
- 509 W Higham St
- 204 N Emmons St
- 500 W Walker St
- 206 S Prospect St
- 506 W Walker St
- 502 W Higham St
- 504 W Higham St
- 500 W Higham St
- 511 W Higham St
- 407 W Higham St
- 206 N Prospect St
- 204 N Prospect St
- 410 W Walker St