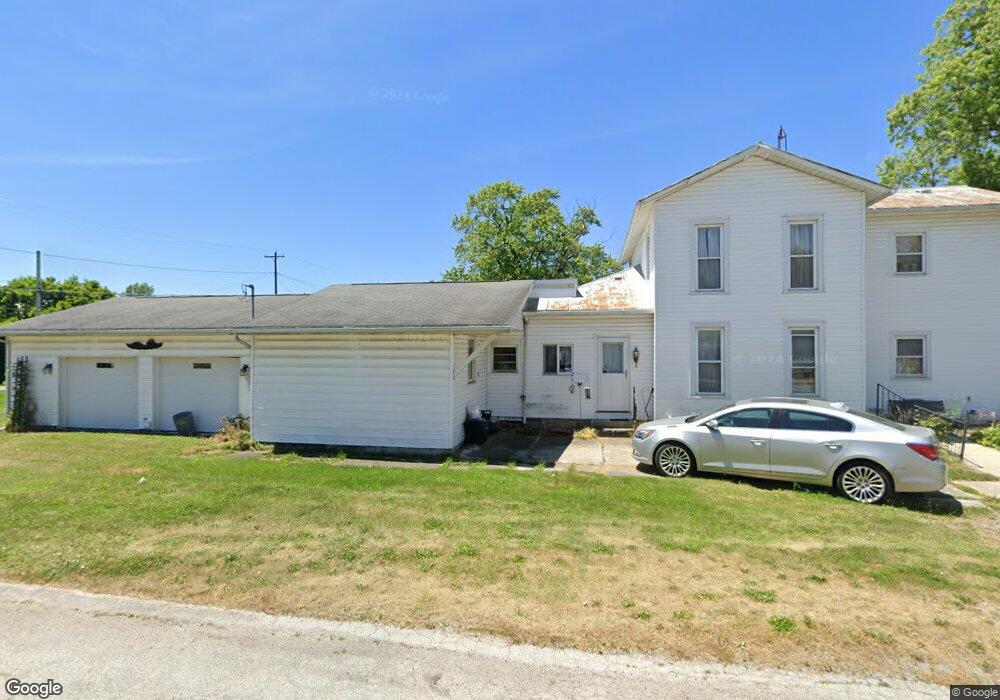
503 W Main St Mc Comb, OH 45858
McComb NeighborhoodEstimated Value: $148,000 - $283,000
3
Beds
1
Bath
2,188
Sq Ft
$93/Sq Ft
Est. Value
About This Home
This home is located at 503 W Main St, Mc Comb, OH 45858 and is currently estimated at $203,510, approximately $93 per square foot. 503 W Main St is a home with nearby schools including McComb Elementary School, McComb Middle School, and Mccomb Local High School.
Ownership History
Date
Name
Owned For
Owner Type
Purchase Details
Closed on
May 10, 2018
Sold by
George Irvin D and George Eva A
Bought by
George Irvin D and George Eva A
Current Estimated Value
Purchase Details
Closed on
Jan 23, 1986
Bought by
George Irvin D and George Eva A
Create a Home Valuation Report for This Property
The Home Valuation Report is an in-depth analysis detailing your home's value as well as a comparison with similar homes in the area
Home Values in the Area
Average Home Value in this Area
Purchase History
| Date | Buyer | Sale Price | Title Company |
|---|---|---|---|
| George Irvin D | -- | None Available | |
| George Irvin D | -- | -- |
Source: Public Records
Tax History Compared to Growth
Tax History
| Year | Tax Paid | Tax Assessment Tax Assessment Total Assessment is a certain percentage of the fair market value that is determined by local assessors to be the total taxable value of land and additions on the property. | Land | Improvement |
|---|---|---|---|---|
| 2024 | $1,506 | $44,350 | $3,220 | $41,130 |
| 2023 | $1,497 | $44,350 | $3,220 | $41,130 |
| 2022 | $1,781 | $44,350 | $3,220 | $41,130 |
| 2021 | $1,342 | $30,120 | $4,480 | $25,640 |
| 2020 | $1,173 | $30,120 | $4,480 | $25,640 |
| 2019 | $1,285 | $30,120 | $4,480 | $25,640 |
| 2018 | $1,159 | $28,440 | $2,800 | $25,640 |
| 2017 | $583 | $28,440 | $2,800 | $25,640 |
| 2016 | $1,089 | $28,440 | $2,800 | $25,640 |
| 2015 | $1,073 | $27,630 | $2,800 | $24,830 |
| 2014 | $1,098 | $28,030 | $2,800 | $25,230 |
| 2012 | $1,372 | $33,200 | $2,800 | $30,400 |
Source: Public Records
Map
Nearby Homes
- 223 N Church St
- 223 Cherry St
- 0 Joshua Rd Unit 6126475
- 3699 State Route 613
- 102 Meadowshire Dr
- 3019 Ohio 235
- 5330 State Route 186
- 4134 County Road 203
- 687 State Route 235
- 358 State Route 613
- 1381 County Road 5
- 8922 Township Road 94
- 7780 Township Road 89
- 9984 State Route 235
- 0 Rock Candy Rd Unit Lot 159
- 0 Rock Candy Rd Unit Lot 170
- 0 Rock Candy Rd Unit Lot 172 206819
- 0 Rock Candy Rd Unit Lot 162
- 0 Rock Candy Rd Unit Lot 171
- 0 Rock Candy Rd Unit Lot 168