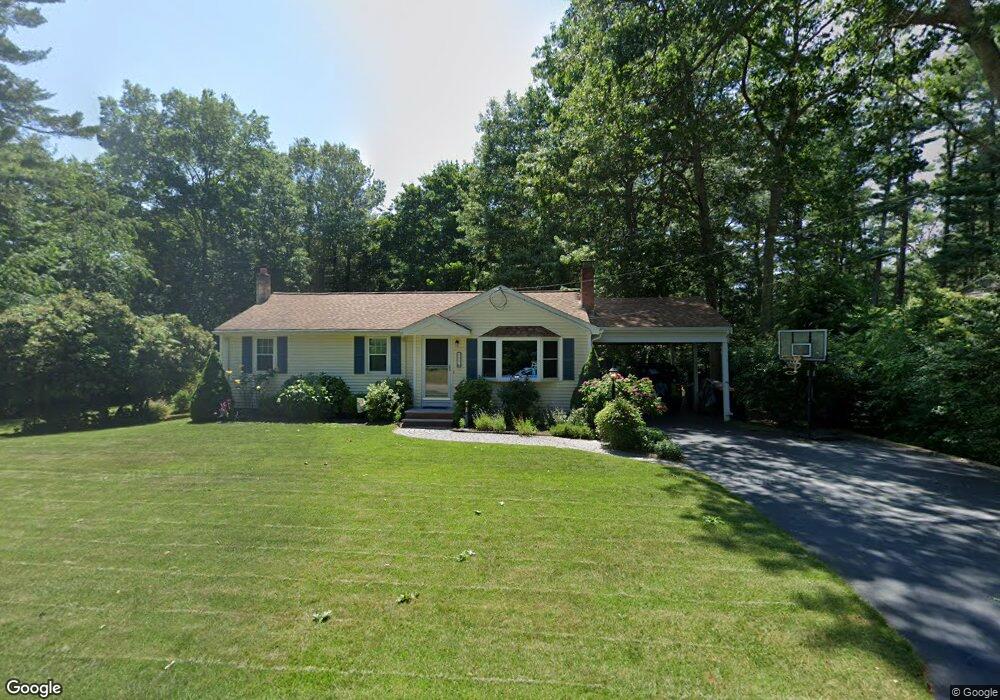
503 Walnut St Bridgewater, MA 02324
Estimated Value: $481,750 - $590,000
3
Beds
1
Bath
1,000
Sq Ft
$515/Sq Ft
Est. Value
About This Home
This home is located at 503 Walnut St, Bridgewater, MA 02324 and is currently estimated at $514,688, approximately $514 per square foot. 503 Walnut St is a home located in Plymouth County with nearby schools including Mitchell Elementary School, Williams Intermediate School, and Bridgewater Middle School.
Ownership History
Date
Name
Owned For
Owner Type
Purchase Details
Closed on
Feb 27, 2012
Sold by
Hines James P
Bought by
Hines James P and Letendre Kara L
Current Estimated Value
Purchase Details
Closed on
Jul 31, 2009
Sold by
Vervates Cheryl A
Bought by
Hines James P and Letendre Kara L
Home Financials for this Owner
Home Financials are based on the most recent Mortgage that was taken out on this home.
Original Mortgage
$236,634
Interest Rate
5.43%
Mortgage Type
Purchase Money Mortgage
Purchase Details
Closed on
Jan 13, 2005
Sold by
Texeira Charles V and Texeira Elinor R
Bought by
Vervates Cheryl A
Create a Home Valuation Report for This Property
The Home Valuation Report is an in-depth analysis detailing your home's value as well as a comparison with similar homes in the area
Home Values in the Area
Average Home Value in this Area
Purchase History
| Date | Buyer | Sale Price | Title Company |
|---|---|---|---|
| Hines James P | -- | -- | |
| Hines James P | -- | -- | |
| Hines James P | $241,000 | -- | |
| Vervates Cheryl A | -- | -- |
Source: Public Records
Mortgage History
| Date | Status | Borrower | Loan Amount |
|---|---|---|---|
| Previous Owner | Vervates Cheryl A | $236,634 |
Source: Public Records
Tax History
| Year | Tax Paid | Tax Assessment Tax Assessment Total Assessment is a certain percentage of the fair market value that is determined by local assessors to be the total taxable value of land and additions on the property. | Land | Improvement |
|---|---|---|---|---|
| 2025 | $4,860 | $410,800 | $189,600 | $221,200 |
| 2024 | $4,726 | $389,300 | $180,500 | $208,800 |
| 2023 | $4,706 | $366,500 | $168,700 | $197,800 |
| 2022 | $4,607 | $321,700 | $148,000 | $173,700 |
| 2021 | $4,603 | $289,500 | $132,100 | $157,400 |
| 2020 | $5,083 | $278,500 | $127,000 | $151,500 |
| 2019 | $4,025 | $271,400 | $127,000 | $144,400 |
| 2018 | $3,671 | $241,700 | $117,200 | $124,500 |
| 2017 | $3,568 | $228,600 | $117,200 | $111,400 |
| 2016 | $3,413 | $219,600 | $114,900 | $104,700 |
| 2015 | $3,419 | $210,500 | $111,600 | $98,900 |
| 2014 | $3,231 | $198,800 | $102,600 | $96,200 |
Source: Public Records
Map
Nearby Homes
- 199 Cherry St
- 211 Cherry St
- 0 Auburn St
- 3 Caswell Way
- 829 Auburn St
- 73 Pratt Ave
- 101 Pratt Ave
- 44 Titicut Ave Unit Lot 45
- 17 Forbes Rd Unit Lot 64
- 46 Titicut Ave
- 0 Flagg St Unit 73421818
- 150 Prattown Ln
- 74 Magnolia Way
- Lot 1 Mill St
- 35 Nelson Dr
- 225 Whitman St
- 215 Whitman St
- 5 Country Dr
- 114 Plain St
- 24 High Pond Dr
Your Personal Tour Guide
Ask me questions while you tour the home.