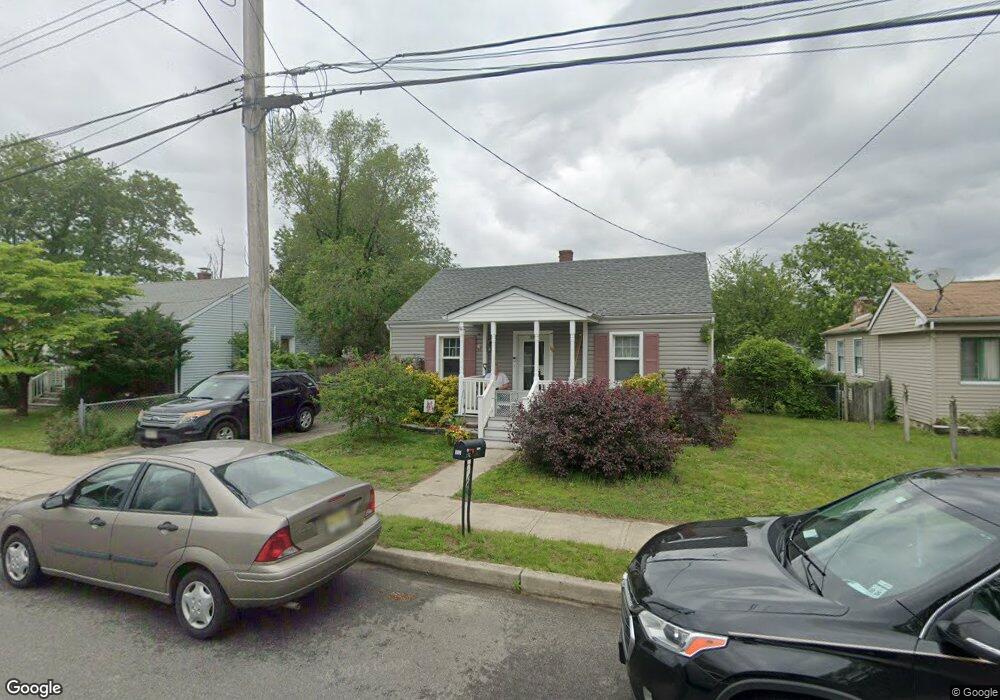
503 Willow St Lakehurst, NJ 08733
Estimated Value: $291,387 - $363,000
2
Beds
1
Bath
1,440
Sq Ft
$228/Sq Ft
Est. Value
About This Home
This home is located at 503 Willow St, Lakehurst, NJ 08733 and is currently estimated at $328,847, approximately $228 per square foot. 503 Willow St is a home located in Ocean County with nearby schools including Lakehurst Elementary School.
Ownership History
Date
Name
Owned For
Owner Type
Purchase Details
Closed on
Aug 8, 2010
Sold by
Naples Family Limited Partnership
Bought by
Demaio James
Current Estimated Value
Home Financials for this Owner
Home Financials are based on the most recent Mortgage that was taken out on this home.
Original Mortgage
$170,701
Outstanding Balance
$113,362
Interest Rate
4.63%
Mortgage Type
FHA
Estimated Equity
$215,485
Purchase Details
Closed on
Jul 27, 2009
Sold by
Drake Donna M
Bought by
Naples Flp
Create a Home Valuation Report for This Property
The Home Valuation Report is an in-depth analysis detailing your home's value as well as a comparison with similar homes in the area
Purchase History
| Date | Buyer | Sale Price | Title Company |
|---|---|---|---|
| Demaio James | $173,000 | Trident Abstract Title Agenc | |
| Naples Flp | $70,200 | None Available |
Source: Public Records
Mortgage History
| Date | Status | Borrower | Loan Amount |
|---|---|---|---|
| Open | Demaio James | $170,701 |
Source: Public Records
Tax History
| Year | Tax Paid | Tax Assessment Tax Assessment Total Assessment is a certain percentage of the fair market value that is determined by local assessors to be the total taxable value of land and additions on the property. | Land | Improvement |
|---|---|---|---|---|
| 2025 | $4,320 | $197,000 | $70,000 | $127,000 |
| 2024 | $4,192 | $197,000 | $70,000 | $127,000 |
Source: Public Records
Map
Nearby Homes
- 602 Willow St
- 518 Cedar St
- 506 Cedar St
- 307 Pine St
- 110 Hibernia Ave
- 809 Birch St
- 74 Aberdeen Ln
- 35 Addlestone Ln
- 30 Addlestone Ln
- 45 Aberdeen Ln
- 20 Aberdeen Ln
- 41 Tarworth Terrace
- 38 Mansfield Ave
- 1881 W Route 37 Unit 287
- 25 Greenwich Ave
- 23 Blackthorn Place
- 93 Mansfield Ave
- 9 Romford Ln
- 29 Oakham Row
- 1223A Thornbury Ln
Your Personal Tour Guide
Ask me questions while you tour the home.