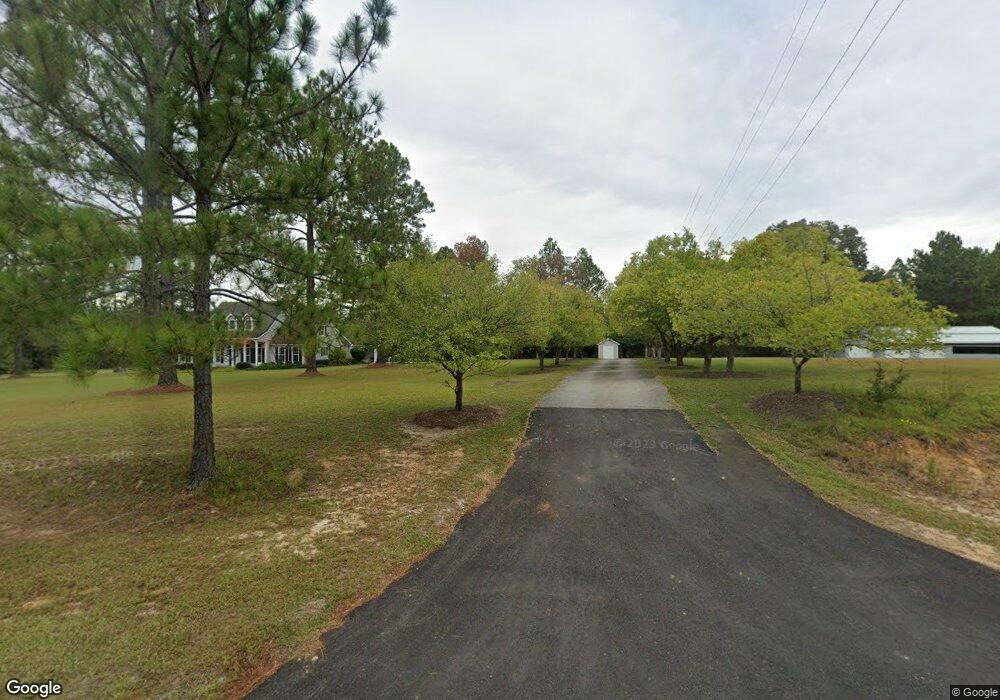
503 Yawn Rd Hazlehurst, GA 31539
Estimated Value: $224,000 - $480,000
3
Beds
3
Baths
2,303
Sq Ft
$147/Sq Ft
Est. Value
About This Home
This home is located at 503 Yawn Rd, Hazlehurst, GA 31539 and is currently estimated at $338,971, approximately $147 per square foot. 503 Yawn Rd is a home located in Jeff Davis County with nearby schools including Jeff Davis Primary School, Jeff Davis Elementary School, and Jeff Davis Middle School.
Ownership History
Date
Name
Owned For
Owner Type
Purchase Details
Closed on
Feb 4, 2011
Sold by
Crosby Greg
Bought by
Horton Brian P and Horton Shelly F
Current Estimated Value
Home Financials for this Owner
Home Financials are based on the most recent Mortgage that was taken out on this home.
Original Mortgage
$167,200
Outstanding Balance
$114,302
Interest Rate
4.76%
Mortgage Type
New Conventional
Estimated Equity
$224,669
Purchase Details
Closed on
Nov 24, 2010
Sold by
Rowland Debbie W
Bought by
Crosby Greg H
Purchase Details
Closed on
May 24, 2010
Sold by
Crosby Debbie
Bought by
Crosby Greg
Purchase Details
Closed on
Dec 18, 2006
Sold by
Crosby Greg H
Bought by
Sharpe Cheri
Purchase Details
Closed on
Mar 22, 2005
Sold by
Crosby Greg H
Bought by
Hulett Michael K and Hulett Jeanette
Purchase Details
Closed on
Nov 29, 1993
Sold by
Crosby Greg and Crosby Debbie
Bought by
Crosby Greg H and Crosby Debbie W
Purchase Details
Closed on
Sep 26, 1990
Bought by
Crosby Greg and Crosby Debbie
Purchase Details
Closed on
Jan 1, 1987
Bought by
Crosby Greg
Create a Home Valuation Report for This Property
The Home Valuation Report is an in-depth analysis detailing your home's value as well as a comparison with similar homes in the area
Home Values in the Area
Average Home Value in this Area
Purchase History
| Date | Buyer | Sale Price | Title Company |
|---|---|---|---|
| Horton Brian P | $176,000 | -- | |
| Crosby Greg H | -- | -- | |
| Crosby Greg | -- | -- | |
| Sharpe Cheri | $45,976 | -- | |
| Hulett Michael K | $18,000 | -- | |
| Crosby Greg H | -- | -- | |
| Crosby Greg | -- | -- | |
| Crosby Greg | $25,000 | -- |
Source: Public Records
Mortgage History
| Date | Status | Borrower | Loan Amount |
|---|---|---|---|
| Open | Horton Brian P | $167,200 |
Source: Public Records
Tax History Compared to Growth
Tax History
| Year | Tax Paid | Tax Assessment Tax Assessment Total Assessment is a certain percentage of the fair market value that is determined by local assessors to be the total taxable value of land and additions on the property. | Land | Improvement |
|---|---|---|---|---|
| 2024 | $3,209 | $111,232 | $7,160 | $104,072 |
| 2023 | $2,045 | $71,612 | $5,550 | $66,062 |
| 2022 | $2,045 | $71,612 | $5,550 | $66,062 |
| 2021 | $2,037 | $71,348 | $5,550 | $65,798 |
| 2020 | $2,037 | $71,348 | $5,550 | $65,798 |
| 2019 | $2,037 | $71,348 | $5,550 | $65,798 |
| 2018 | $2,223 | $77,659 | $5,550 | $72,109 |
| 2017 | $2,049 | $72,935 | $5,550 | $67,385 |
| 2016 | $2,013 | $72,935 | $5,550 | $67,385 |
| 2015 | -- | $73,796 | $5,550 | $68,247 |
| 2014 | -- | $73,960 | $5,550 | $68,410 |
Source: Public Records
Map
Nearby Homes
- 183 John Rentz Rd
- 4419 Altamaha School Rd
- -- Hammond Powell Rd
- 0 Ernest Carter Rd
- 0 Golden Isle W
- TBD Golden Isle W
- 212 Arthur McNeal Rd
- 43 Graham Methodist Church Rd
- 138 Coley Reagin Rd
- 105 Lonnie Johnson Rd
- 5686 Golden Isle W
- 100 Doc Hunter Rd
- 0 Melton Chapel Rd
- Tract 9 Sellers Rd
- 2000-4 Sellers Rd
- TRACT 11 Sellers Rd
- TRACT 10 Sellers Rd
- TRACT 12 Sellers Rd
- 0 Sellers Rd
- 11 Sellers Rd
- 510 Yawn Rd
- 0 Yawn Rd Unit 18074
- 0 Yawn Rd Unit 12931
- 0 Yawn Rd Unit 8532436
- 0 Yawn Rd
- 571 Yawn Rd
- 575 Yawn Rd
- 40 Ginger Farm Rd
- 28 Martin Sellers Rd
- 535 Yawn Rd
- 3 Ginger Farm Rd Unit 1
- 22 Oakwood Ln
- 601 Yawn Rd
- 38 Oakwood Ln
- 61 Ginger Farm Rd
- 4 Oakwood Ln
- 602 Yawn Rd
- 66 Martin Sellers Rd
- 33 Maplewood Rd
- 50 Oakview Rd