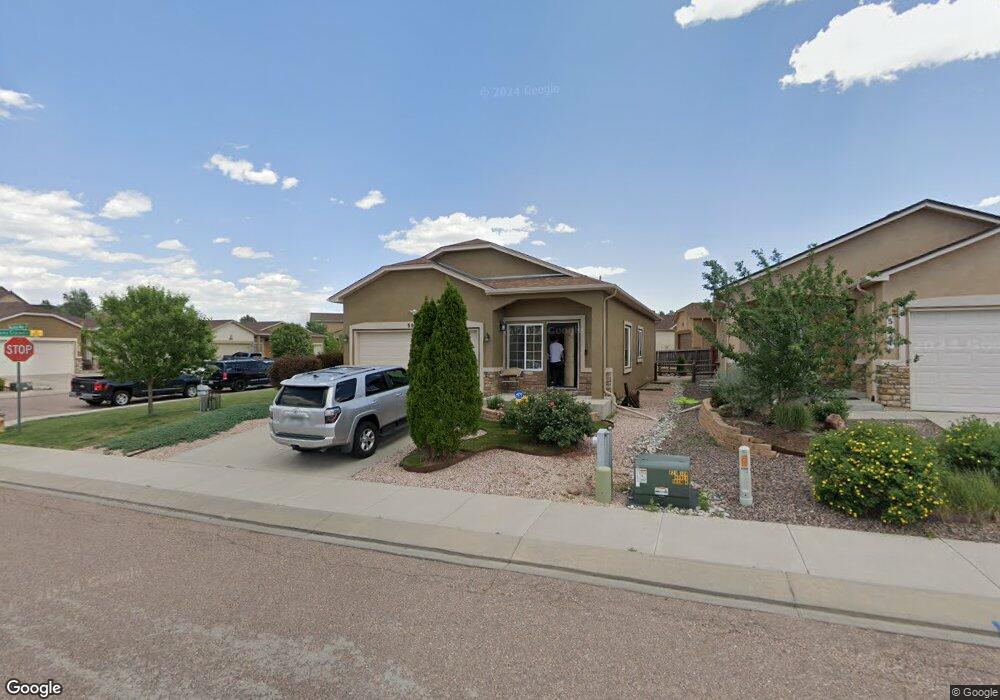
5031 Mountain Man Ln Colorado Springs, CO 80922
Stetson Hills NeighborhoodEstimated Value: $430,272 - $470,000
3
Beds
3
Baths
1,130
Sq Ft
$404/Sq Ft
Est. Value
About This Home
This home is located at 5031 Mountain Man Ln, Colorado Springs, CO 80922 and is currently estimated at $456,568, approximately $404 per square foot. 5031 Mountain Man Ln is a home located in El Paso County with nearby schools including Stetson Elementary School, Skyview Middle School, and Sand Creek High School.
Ownership History
Date
Name
Owned For
Owner Type
Purchase Details
Closed on
Jun 27, 2014
Sold by
Smith Brigitte and Smith Gregory B
Bought by
Nguyen Van
Current Estimated Value
Home Financials for this Owner
Home Financials are based on the most recent Mortgage that was taken out on this home.
Original Mortgage
$217,550
Outstanding Balance
$166,142
Interest Rate
4.23%
Mortgage Type
New Conventional
Estimated Equity
$290,426
Purchase Details
Closed on
Sep 12, 2008
Sold by
Safe Harbor Homes Llc
Bought by
Smith Gregory B and Smith Brigitte
Home Financials for this Owner
Home Financials are based on the most recent Mortgage that was taken out on this home.
Original Mortgage
$226,330
Interest Rate
6.6%
Mortgage Type
FHA
Purchase Details
Closed on
Apr 2, 2007
Sold by
Howard & Co Homes Inc
Bought by
Safe Harbor Homes Llc
Home Financials for this Owner
Home Financials are based on the most recent Mortgage that was taken out on this home.
Original Mortgage
$196,632
Interest Rate
6.15%
Mortgage Type
Construction
Create a Home Valuation Report for This Property
The Home Valuation Report is an in-depth analysis detailing your home's value as well as a comparison with similar homes in the area
Home Values in the Area
Average Home Value in this Area
Purchase History
| Date | Buyer | Sale Price | Title Company |
|---|---|---|---|
| Nguyen Van | $229,000 | Land Title Guarantee Company | |
| Smith Gregory B | $230,450 | Fahtco | |
| Safe Harbor Homes Llc | $60,000 | Fahtco |
Source: Public Records
Mortgage History
| Date | Status | Borrower | Loan Amount |
|---|---|---|---|
| Open | Nguyen Van | $217,550 | |
| Previous Owner | Smith Gregory B | $226,330 | |
| Previous Owner | Safe Harbor Homes Llc | $196,632 |
Source: Public Records
Tax History Compared to Growth
Tax History
| Year | Tax Paid | Tax Assessment Tax Assessment Total Assessment is a certain percentage of the fair market value that is determined by local assessors to be the total taxable value of land and additions on the property. | Land | Improvement |
|---|---|---|---|---|
| 2025 | $1,884 | $33,500 | -- | -- |
| 2024 | $1,784 | $33,590 | $7,770 | $25,820 |
| 2023 | $1,784 | $33,590 | $7,770 | $25,820 |
| 2022 | $1,407 | $22,640 | $7,010 | $15,630 |
| 2021 | $1,465 | $23,290 | $7,210 | $16,080 |
| 2020 | $1,331 | $20,910 | $6,010 | $14,900 |
| 2019 | $1,317 | $20,910 | $6,010 | $14,900 |
| 2018 | $1,091 | $17,000 | $5,260 | $11,740 |
| 2017 | $1,097 | $17,000 | $5,260 | $11,740 |
| 2016 | $1,085 | $16,600 | $4,950 | $11,650 |
| 2015 | $1,086 | $16,600 | $4,950 | $11,650 |
| 2014 | $963 | $14,440 | $4,680 | $9,760 |
Source: Public Records
Map
Nearby Homes
- 5275 Belle Star Dr
- 7010 Highcroft Dr
- 5041 Weaver Dr
- 5307 Belle Star Dr
- 7020 Hillbeck Dr
- 6330 Emma Ln
- 7120 Highcroft Dr
- 5315 War Paint Place
- 4034 Ryedale Way
- 5175 Stone Fence Dr
- 6185 Hearth Ct
- 5225 Stone Fence Dr
- 6170 Katy Ct
- 5465 War Paint Place
- 4604 Desert Varnish Dr
- 4632 Hidden River Dr
- 6180 Kettle Ct
- 6030 Hearth Ct
- 5455 Geode Ln
- 5359 Gentle Wind Rd
- 5021 Mountain Man Ln
- 5021 Mountain Man Ln
- 5021 Mountain Man Ln Unit 80922
- 5011 Mountain Man Ln
- 7069 Davey Crocket Ct
- 5030 Mountain Man Ln
- 5020 Mountain Man Ln
- 7056 Davey Crocket Ct
- 5010 Mountain Man Ln
- 7050 Davey Crocket Ct
- 7062 Davey Crocket Ct
- 7075 Davey Crocket Ct
- 7081 Davey Crocket Ct
- 7068 Davey Crocket Ct
- 7080 Davey Crocket Ct
- 7038 Davey Crocket Ct
- 7027 Davey Crocket Ct
- 7074 Davey Crocket Ct
- 6970 Peckham Ln
- 6960 Peckham Ln