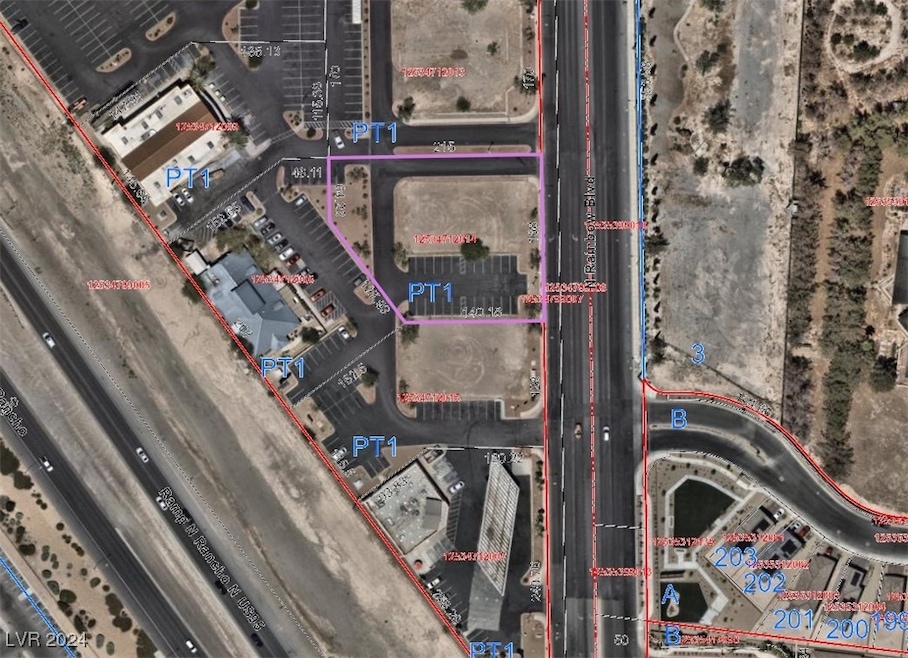
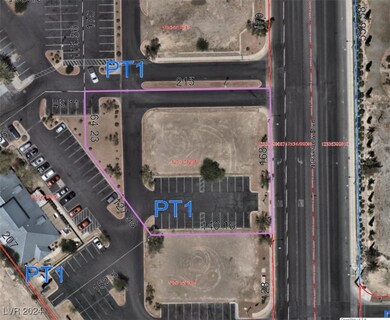
5031 N Rainbow Blvd Unit 110 Las Vegas, NV 89130
Estimated payment $4,218/month
About This Lot
0.74 Acres Commercial / 5031 N Rainbow / Fully finished commercial Lot /Surrounded by a C-store Gas station & a Bar Tavern / Hard zoning C2 General Commercial / Near the hard corner of N Rainbow & Rancho across the street from the Santa Fe Hotel & Casino/ ready to build and vertical development / High traffic count / Brand new apartment & Housing communities surrounding the property / &FOR LEASE, BUILD TO SUIT & JV OPTIONS / OWNER/BROKER/LICENSEE
Listing Agent
Las Vegas Investments & Realty Brokerage Phone: 702-331-2800 License #B.0054941 Listed on: 09/25/2024
Property Details
Property Type
- Land
Est. Annual Taxes
- $3,089
Lot Details
- 0.74 Acre Lot
Community Details
- No Home Owners Association
- Rancho Santa Fe Center Subdivision
Map
Home Values in the Area
Average Home Value in this Area
Tax History
| Year | Tax Paid | Tax Assessment Tax Assessment Total Assessment is a certain percentage of the fair market value that is determined by local assessors to be the total taxable value of land and additions on the property. | Land | Improvement |
|---|---|---|---|---|
| 2025 | $3,335 | $147,197 | $135,383 | $11,814 |
| 2024 | $3,089 | $147,197 | $135,383 | $11,814 |
| 2023 | $3,089 | $123,877 | $112,819 | $11,058 |
| 2022 | $2,860 | $117,312 | $107,178 | $10,134 |
| 2021 | $2,648 | $111,202 | $101,537 | $9,665 |
| 2020 | $2,456 | $111,104 | $101,537 | $9,567 |
| 2019 | $2,302 | $105,323 | $95,896 | $9,427 |
| 2018 | $1,902 | $90,255 | $90,255 | $0 |
| 2017 | $2,589 | $78,973 | $78,973 | $0 |
| 2016 | $1,781 | $54,153 | $54,153 | $0 |
| 2015 | $1,776 | $54,153 | $54,153 | $0 |
| 2014 | $1,776 | $74,460 | $74,460 | $0 |
Property History
| Date | Event | Price | List to Sale | Price per Sq Ft |
|---|---|---|---|---|
| 09/25/2024 09/25/24 | For Sale | $750,000 | -- | -- |
Purchase History
| Date | Type | Sale Price | Title Company |
|---|---|---|---|
| Bargain Sale Deed | $375,000 | First American Title | |
| Bargain Sale Deed | $400,000 | First American Title | |
| Deed In Lieu Of Foreclosure | $600,000 | Nevada Title Las Vegas | |
| Interfamily Deed Transfer | -- | Nevada Title Company | |
| Bargain Sale Deed | $1,275,000 | Nevada Title Company | |
| Bargain Sale Deed | $1,450,000 | Southwest Title | |
| Bargain Sale Deed | $1,427,219 | -- | |
| Trustee Deed | $1,536,084 | Southwest Title | |
| Quit Claim Deed | -- | -- | |
| Quit Claim Deed | -- | -- |
Mortgage History
| Date | Status | Loan Amount | Loan Type |
|---|---|---|---|
| Previous Owner | $1,260,000 | Commercial |
Source: Las Vegas REALTORS®
MLS Number: 2620158
APN: 125-34-712-014
Disclaimer: Certain information contained herein is derived from information provided by parties other than Homes.com. All information provided is deemed reliable, but is not guaranteed to be accurate and should be independently verified.
![]() The data relating to real estate for sale on this web site comes in part from the INTERNET DATA EXCHANGE Program of the Greater Las Vegas Association of REALTORS® MLS. Real estate listings held by brokerage firms other than this site owner are marked with the IDX logo. Information is deemed reliable but not guaranteed. Copyright 2025 of the Greater Las Vegas Association of REALTORS® MLS. All rights reserved.
The data relating to real estate for sale on this web site comes in part from the INTERNET DATA EXCHANGE Program of the Greater Las Vegas Association of REALTORS® MLS. Real estate listings held by brokerage firms other than this site owner are marked with the IDX logo. Information is deemed reliable but not guaranteed. Copyright 2025 of the Greater Las Vegas Association of REALTORS® MLS. All rights reserved.
- 6802 W Craig Rd
- 6628 Plumflower Ln
- 6732 Accent Ct
- 6741 Accent Ct
- 4252 Orangeblossom St
- 6508 Faith Peak Dr
- 6608 Messenger Ct
- 6900 Quail Hollow Dr
- 6636 Painted Desert Dr
- 6425 Wheelbarrow Peak Dr
- 4229 Jadestone Ave
- 4052 Cape Sand Dr
- 4217 Jasper Ave
- 4000 Dale Evans Dr
- 3351 Dancing Waters St
- 3344 Dancing Waters St
- 3350 Dancing Waters St
- 4012 Castle Cove Dr
- 6429 Roy Rogers Dr Unit 2
- 4356 Perfect Drift St
- 6928 Atrium Ave Unit 3
- 4650 N Rainbow Blvd
- 7032 Golden Desert Ave Unit 4
- 6928 Oyster Shell Dr
- 6929 Oyster Shell Dr
- 6885 W Lone Mountain Rd
- 6480 Bentley Wood Ct
- 4773 Longstock Ct
- 4268 Perfect Drift St
- 4413 Ornate Ct
- 4041 Hazelridge Dr
- 7228 Wild Carrot Ave
- 4 Hampstead Heath Ct
- 4069 N Browndeer Cir
- 4212 Haven Hurst Ct Unit 10
- 4112 N Dream Day St
- 4253 Olympic Point Dr
- 6221 Joaquin Hills Ct
- 6661 Telegraph Rd
- 4140 Brassy Boots Ct
