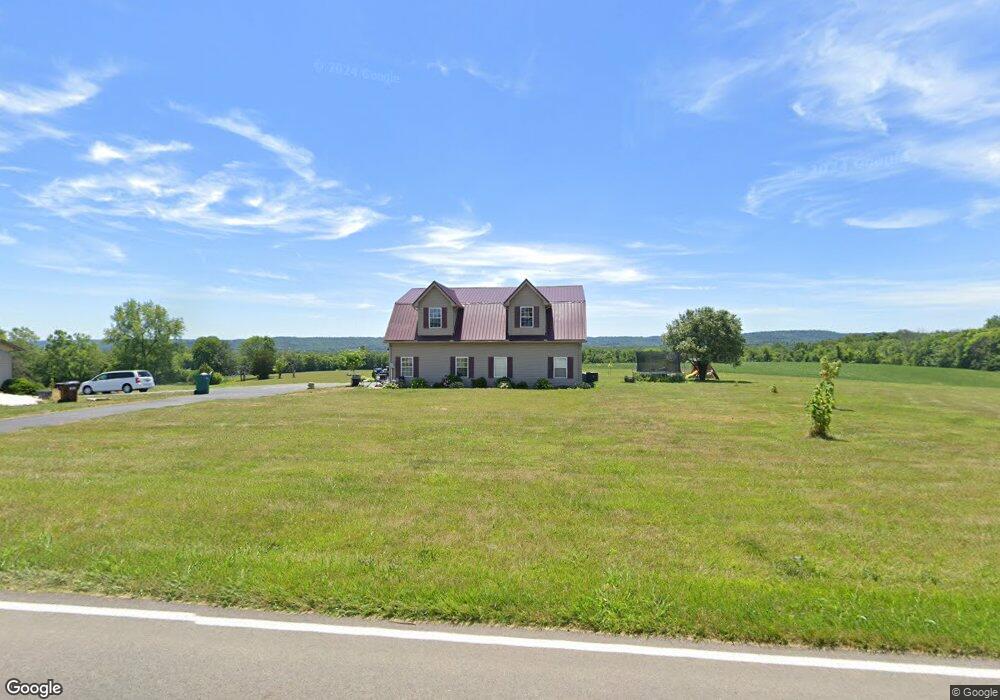
5036 Westfall Rd Frankfort, OH 45628
Estimated Value: $312,000 - $404,000
5
Beds
3
Baths
2,425
Sq Ft
$149/Sq Ft
Est. Value
About This Home
This home is located at 5036 Westfall Rd, Frankfort, OH 45628 and is currently estimated at $360,168, approximately $148 per square foot. 5036 Westfall Rd is a home located in Ross County with nearby schools including Adena Elementary School, Adena Middle School, and Adena High School.
Ownership History
Date
Name
Owned For
Owner Type
Purchase Details
Closed on
Jul 24, 2018
Sold by
Mcgirr Mark A
Bought by
Vickers Thomas Patrick and Vickers Kaitlyn Sue
Current Estimated Value
Home Financials for this Owner
Home Financials are based on the most recent Mortgage that was taken out on this home.
Original Mortgage
$110,000
Outstanding Balance
$95,542
Interest Rate
4.6%
Mortgage Type
Future Advance Clause Open End Mortgage
Estimated Equity
$264,626
Purchase Details
Closed on
Dec 14, 2012
Sold by
Mcquay Lloyd M and Mcquay Della M
Bought by
Mcgirr Mark A
Home Financials for this Owner
Home Financials are based on the most recent Mortgage that was taken out on this home.
Original Mortgage
$179,784
Interest Rate
3.34%
Mortgage Type
VA
Purchase Details
Closed on
Oct 14, 1999
Bought by
Mcgirr Mark A
Create a Home Valuation Report for This Property
The Home Valuation Report is an in-depth analysis detailing your home's value as well as a comparison with similar homes in the area
Home Values in the Area
Average Home Value in this Area
Purchase History
| Date | Buyer | Sale Price | Title Company |
|---|---|---|---|
| Vickers Thomas Patrick | $225,000 | Northwest Title | |
| Mcgirr Mark A | $176,000 | Arrow Title Agency Llc | |
| Mcgirr Mark A | -- | -- |
Source: Public Records
Mortgage History
| Date | Status | Borrower | Loan Amount |
|---|---|---|---|
| Open | Vickers Thomas Patrick | $110,000 | |
| Previous Owner | Mcgirr Mark A | $179,784 |
Source: Public Records
Tax History Compared to Growth
Tax History
| Year | Tax Paid | Tax Assessment Tax Assessment Total Assessment is a certain percentage of the fair market value that is determined by local assessors to be the total taxable value of land and additions on the property. | Land | Improvement |
|---|---|---|---|---|
| 2024 | $3,606 | $117,780 | $4,380 | $113,400 |
| 2023 | $3,606 | $104,520 | $4,380 | $100,140 |
| 2022 | $3,499 | $104,520 | $4,380 | $100,140 |
| 2021 | $3,002 | $83,610 | $3,500 | $80,110 |
| 2020 | $3,083 | $83,610 | $3,500 | $80,110 |
| 2019 | $3,019 | $83,610 | $3,500 | $80,110 |
| 2018 | $2,692 | $73,140 | $2,400 | $70,740 |
| 2017 | $2,701 | $69,600 | $2,400 | $67,200 |
| 2016 | $2,497 | $69,600 | $2,400 | $67,200 |
| 2015 | $2,222 | $61,620 | $2,400 | $59,220 |
| 2014 | $2,275 | $64,740 | $2,400 | $62,340 |
| 2013 | $1,186 | $33,570 | $2,400 | $31,170 |
Source: Public Records
Map
Nearby Homes
- 4249 Ragged Ridge Rd
- 2025 Little Creek Rd
- 235 Lagerham Ln
- 709 Ragged Ridge Rd Unit 809
- 709 Ragged Ridge Rd
- 130 W Springfield St
- 64 Springfield St
- 139 W Springfield St
- 107 W Springfield St
- 68 Starr Ave
- 40 N 2nd St
- 0 N Sd Rt 28
- 0 N Sd St Rt 28
- 0 N Sd Rt 28 Unit 225026807
- 10597 State Route 28
- 813 Climer Ln
- 115 N 2nd St
- 10605 State Route 28
- 43 N Main St
- 0 State Route 28
- 5036 Westfall Rd
- 4981 Westfall Rd
- 4939 Westfall Rd
- 5043 Westfall Rd
- 4873 Westfall Rd
- 4875 Westfall Rd
- 4761 Westfall Rd
- 4766 Westfall Rd
- 4935 Westfall Rd
- 4773 Westfall Rd
- 4758 Westfall Rd
- 4760 Westfall Rd
- 4750 Westfall Rd
- 4762 Westfall Rd
- 5293 Westfall Rd
- 4670 Westfall Rd
- 5291 Westfall Rd
- 289 Cupps Bridge Rd
- 5347 Westfall Rd
- 225 Cupps Bridge Rd