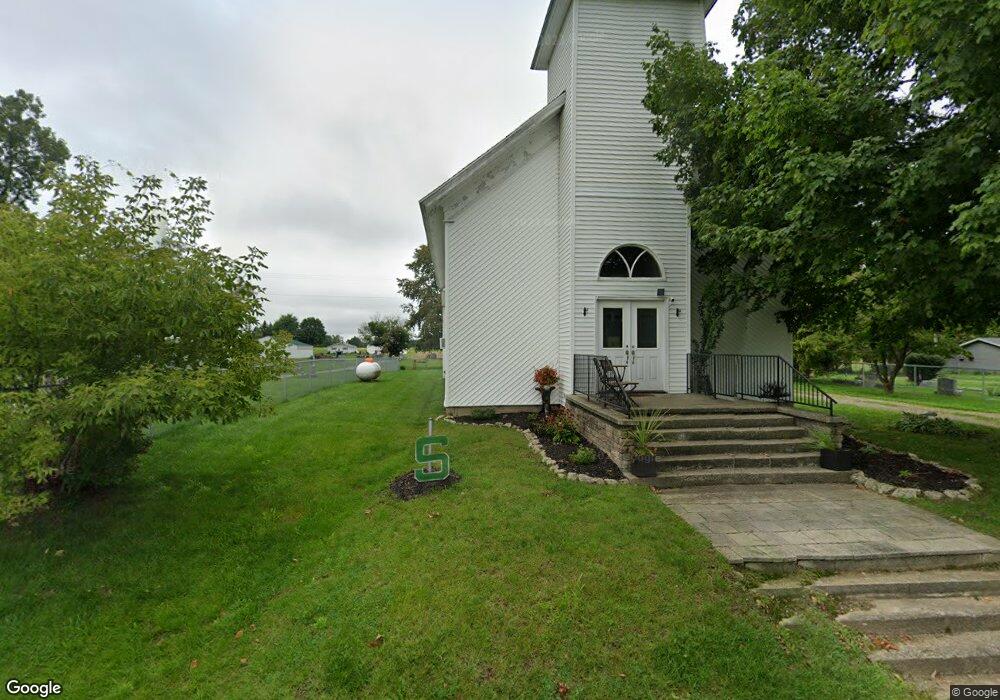
5037 Bell Oak Rd Webberville, MI 48892
Estimated Value: $166,000 - $242,000
--
Bed
--
Bath
1,984
Sq Ft
$99/Sq Ft
Est. Value
About This Home
This home is located at 5037 Bell Oak Rd, Webberville, MI 48892 and is currently estimated at $196,468, approximately $99 per square foot. 5037 Bell Oak Rd is a home located in Ingham County with nearby schools including Webberville Elementary School, Webberville Middle School, and Webberville High School.
Ownership History
Date
Name
Owned For
Owner Type
Purchase Details
Closed on
Aug 15, 2013
Sold by
Windt Nicholas M and Windt Kristy S
Bought by
Woodworth David M
Current Estimated Value
Home Financials for this Owner
Home Financials are based on the most recent Mortgage that was taken out on this home.
Original Mortgage
$83,361
Outstanding Balance
$61,644
Interest Rate
4.25%
Mortgage Type
FHA
Estimated Equity
$134,824
Purchase Details
Closed on
Sep 29, 2005
Sold by
Ruthig Michael and Ruthig Kristy
Bought by
Windt Nicholas M and Feldpausch Kristy S
Home Financials for this Owner
Home Financials are based on the most recent Mortgage that was taken out on this home.
Original Mortgage
$75,905
Interest Rate
5.89%
Mortgage Type
Fannie Mae Freddie Mac
Purchase Details
Closed on
Apr 15, 2003
Sold by
Crossroads United Methodist Church
Bought by
Ruthig Michael
Create a Home Valuation Report for This Property
The Home Valuation Report is an in-depth analysis detailing your home's value as well as a comparison with similar homes in the area
Home Values in the Area
Average Home Value in this Area
Purchase History
| Date | Buyer | Sale Price | Title Company |
|---|---|---|---|
| Woodworth David M | $84,900 | Diversified National Title | |
| Windt Nicholas M | $79,900 | Midstate | |
| Ruthig Michael | $43,500 | Midstate | |
| Ruthig Michael | -- | Landamerica Transnation |
Source: Public Records
Mortgage History
| Date | Status | Borrower | Loan Amount |
|---|---|---|---|
| Open | Woodworth David M | $83,361 | |
| Previous Owner | Windt Nicholas M | $75,905 |
Source: Public Records
Tax History Compared to Growth
Tax History
| Year | Tax Paid | Tax Assessment Tax Assessment Total Assessment is a certain percentage of the fair market value that is determined by local assessors to be the total taxable value of land and additions on the property. | Land | Improvement |
|---|---|---|---|---|
| 2025 | $2,190 | $81,200 | $3,400 | $77,800 |
| 2024 | $2,047 | $81,300 | $3,400 | $77,900 |
| 2023 | $2,047 | $80,600 | $3,400 | $77,200 |
| 2022 | $1,853 | $70,300 | $3,500 | $66,800 |
| 2021 | $1,792 | $66,400 | $3,000 | $63,400 |
| 2020 | $1,711 | $56,100 | $2,300 | $53,800 |
| 2019 | $1,683 | $56,100 | $2,300 | $53,800 |
| 2018 | $1,681 | $48,030 | $2,300 | $45,730 |
| 2017 | $1,476 | $48,030 | $2,300 | $45,730 |
| 2016 | -- | $42,480 | $2,300 | $40,180 |
| 2015 | -- | $42,590 | $4,600 | $37,990 |
| 2014 | -- | $36,210 | $5,000 | $31,210 |
Source: Public Records
Map
Nearby Homes
- 4815 N Herrington Rd
- 3785 Morrice Rd
- 4641 E Allen Rd
- 10125 Chase Lake Rd
- 11121 Hannah Jane Dr
- 00 W Vogt Rd
- 11119 Garrett Dr
- 1355 E Lovejoy Rd
- 1551 E Lovejoy Rd
- 00 W Sherwood Rd
- 10133 W Allen Rd
- 2832 Gramer Rd
- 2860 Black Oak St
- 3435 Dietz Rd
- 2865 E Sherwood Rd
- 324 W Chestnut St
- 223 S Summit
- 316 S Main St
- 350 S Maple St
- 9511 W Allen Rd