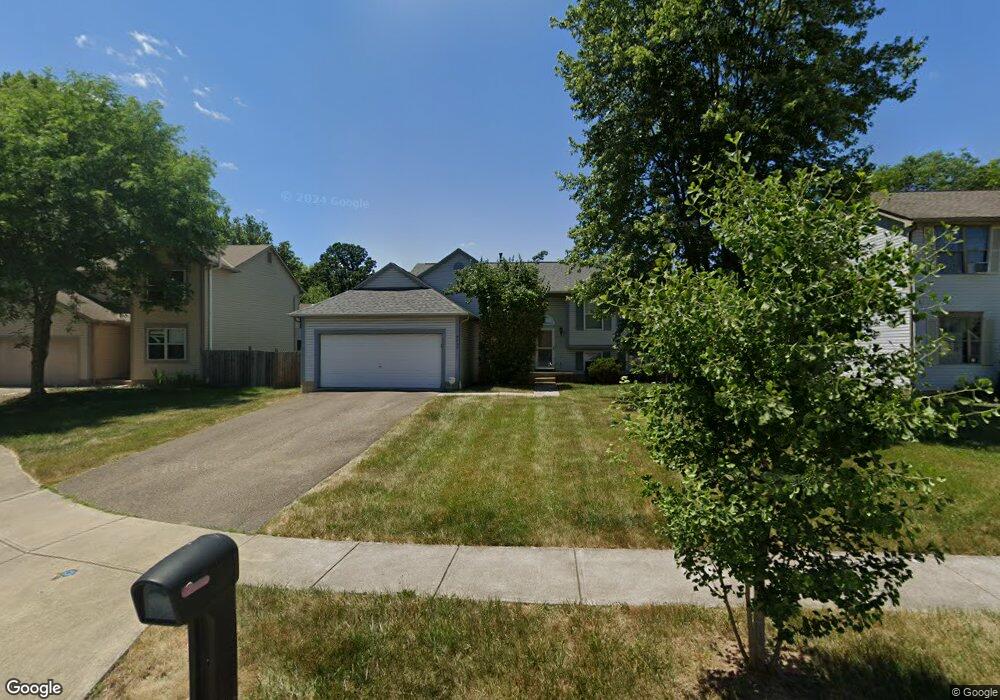
5037 Kilbourne Run Place Columbus, OH 43229
Forest Park East NeighborhoodEstimated Value: $238,490 - $282,000
4
Beds
2
Baths
1,034
Sq Ft
$256/Sq Ft
Est. Value
About This Home
This home is located at 5037 Kilbourne Run Place, Columbus, OH 43229 and is currently estimated at $264,623, approximately $255 per square foot. 5037 Kilbourne Run Place is a home located in Franklin County with nearby schools including Avalon Elementary School, Northgate Intermediate, and Woodward Park Middle School.
Ownership History
Date
Name
Owned For
Owner Type
Purchase Details
Closed on
Feb 24, 2009
Sold by
Beneficial Ohio Inc
Bought by
Tillman Michael L
Current Estimated Value
Home Financials for this Owner
Home Financials are based on the most recent Mortgage that was taken out on this home.
Original Mortgage
$101,527
Outstanding Balance
$64,797
Interest Rate
5.2%
Mortgage Type
FHA
Estimated Equity
$199,826
Purchase Details
Closed on
Jan 13, 2009
Sold by
Mcrae Denise L and Harris Denise I
Bought by
Beneficial Ohio Inc
Home Financials for this Owner
Home Financials are based on the most recent Mortgage that was taken out on this home.
Original Mortgage
$101,527
Outstanding Balance
$64,797
Interest Rate
5.2%
Mortgage Type
FHA
Estimated Equity
$199,826
Purchase Details
Closed on
Jun 19, 1998
Sold by
Layman Homes Inc
Bought by
Mcrae Larry and Mcrae Denise I
Home Financials for this Owner
Home Financials are based on the most recent Mortgage that was taken out on this home.
Original Mortgage
$126,650
Interest Rate
7.27%
Mortgage Type
FHA
Create a Home Valuation Report for This Property
The Home Valuation Report is an in-depth analysis detailing your home's value as well as a comparison with similar homes in the area
Home Values in the Area
Average Home Value in this Area
Purchase History
| Date | Buyer | Sale Price | Title Company |
|---|---|---|---|
| Tillman Michael L | $103,400 | Sovereign | |
| Beneficial Ohio Inc | $90,000 | None Available | |
| Mcrae Larry | $129,300 | Preferred Title Agency Inc |
Source: Public Records
Mortgage History
| Date | Status | Borrower | Loan Amount |
|---|---|---|---|
| Open | Tillman Michael L | $101,527 | |
| Previous Owner | Mcrae Larry | $126,650 |
Source: Public Records
Tax History Compared to Growth
Tax History
| Year | Tax Paid | Tax Assessment Tax Assessment Total Assessment is a certain percentage of the fair market value that is determined by local assessors to be the total taxable value of land and additions on the property. | Land | Improvement |
|---|---|---|---|---|
| 2024 | $3,005 | $66,960 | $22,750 | $44,210 |
| 2023 | $2,967 | $66,955 | $22,750 | $44,205 |
| 2022 | $2,667 | $51,420 | $11,830 | $39,590 |
| 2021 | $2,761 | $51,420 | $11,830 | $39,590 |
| 2020 | $2,742 | $51,420 | $11,830 | $39,590 |
| 2019 | $2,313 | $38,120 | $8,750 | $29,370 |
| 2018 | $2,242 | $38,120 | $8,750 | $29,370 |
| 2017 | $2,354 | $38,120 | $8,750 | $29,370 |
| 2016 | $2,397 | $36,190 | $8,470 | $27,720 |
| 2015 | $2,176 | $36,190 | $8,470 | $27,720 |
| 2014 | $2,182 | $36,190 | $8,470 | $27,720 |
| 2013 | $1,133 | $38,115 | $8,925 | $29,190 |
Source: Public Records
Map
Nearby Homes
- 2550 Minerva Ave
- 2500 Maplewood Dr
- 2158 Kilbourne Ave
- 5056 Northtowne Blvd Unit 5054
- 0 Claridon Rd
- 4885 Northtowne Blvd
- 2576 Claridon Rd
- 2294 Teakwood Dr
- 2058 Northcliff Dr
- 2134 Trent Rd
- 2244 Balmoral Rd
- 4849 Heatherton Dr
- 2903 Kilbourne Ave
- 5204 Honeytree Loop W
- 0 Chester Rd
- 2691 Northwold Rd
- 2734 Alder Vista Dr
- 0 Alder Vista Dr
- 0 Abington Rd Unit 224031739
- 0 Abington Rd Unit 224031704
- 5045 Kilbourne Run Place
- 5029 Kilbourne Run Place
- 5053 Kilbourne Run Place
- 5038 Rolling Rock Ct
- 5030 Rolling Rock Ct
- 5036 Kilbourne Run Place
- 5054 Rolling Rock Ct
- 5061 Kilbourne Run Place
- 5061 Kilbourne Run Place Unit P
- 5044 Kilbourne Run Place
- 5028 Kilbourne Run Place
- 5052 Kilbourne Run Place
- 5062 Rolling Rock Ct
- 5069 Kilbourne Run Place
- 2578 Minerva Ave
- 2578 Minerva Ave
- 2369 Rolling Rock Dr
- 0 E Minerva Ave
- 5060 Kilbourne Run Place
- 5070 Rolling Rock Ct