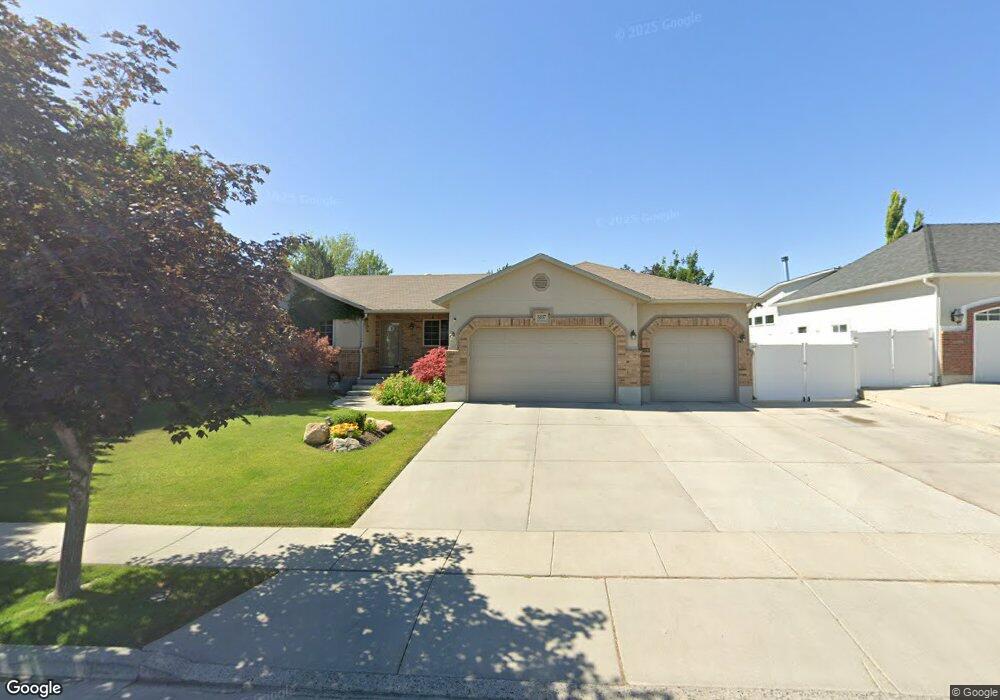
5037 Pine Laurel Ln West Jordan, UT 84081
Copper Hills NeighborhoodEstimated Value: $646,000 - $721,552
3
Beds
3
Baths
1,916
Sq Ft
$360/Sq Ft
Est. Value
About This Home
This home is located at 5037 Pine Laurel Ln, West Jordan, UT 84081 and is currently estimated at $688,888, approximately $359 per square foot. 5037 Pine Laurel Ln is a home located in Salt Lake County with nearby schools including Copper Canyon School, West Hills Middle School, and Copper Hills High School.
Ownership History
Date
Name
Owned For
Owner Type
Purchase Details
Closed on
Dec 12, 2013
Sold by
Rowland Michael J and Rowland Janet
Bought by
Gordon David S and Gordon Debra
Current Estimated Value
Home Financials for this Owner
Home Financials are based on the most recent Mortgage that was taken out on this home.
Original Mortgage
$319,113
Outstanding Balance
$240,291
Interest Rate
4.4%
Mortgage Type
FHA
Estimated Equity
$448,597
Purchase Details
Closed on
Nov 8, 2002
Sold by
Hj Builders Inc
Bought by
Rowland Michael J and Rowland Janet
Home Financials for this Owner
Home Financials are based on the most recent Mortgage that was taken out on this home.
Original Mortgage
$205,277
Interest Rate
5.89%
Mortgage Type
Seller Take Back
Purchase Details
Closed on
May 3, 2002
Sold by
Kfp Corp
Bought by
Hj Builders Inc
Create a Home Valuation Report for This Property
The Home Valuation Report is an in-depth analysis detailing your home's value as well as a comparison with similar homes in the area
Home Values in the Area
Average Home Value in this Area
Purchase History
| Date | Buyer | Sale Price | Title Company |
|---|---|---|---|
| Gordon David S | -- | First American Title | |
| Rowland Michael J | -- | Merrill Title | |
| Hj Builders Inc | -- | Meridian Title |
Source: Public Records
Mortgage History
| Date | Status | Borrower | Loan Amount |
|---|---|---|---|
| Open | Gordon David S | $319,113 | |
| Previous Owner | Rowland Michael J | $205,277 |
Source: Public Records
Tax History Compared to Growth
Tax History
| Year | Tax Paid | Tax Assessment Tax Assessment Total Assessment is a certain percentage of the fair market value that is determined by local assessors to be the total taxable value of land and additions on the property. | Land | Improvement |
|---|---|---|---|---|
| 2025 | $3,458 | $684,400 | $173,400 | $511,000 |
| 2024 | $3,458 | $665,300 | $168,500 | $496,800 |
| 2023 | $3,525 | $639,200 | $162,100 | $477,100 |
| 2022 | $3,536 | $630,800 | $158,900 | $471,900 |
| 2021 | $3,004 | $487,900 | $124,000 | $363,900 |
| 2020 | $2,919 | $444,800 | $124,000 | $320,800 |
| 2019 | $2,859 | $427,300 | $124,000 | $303,300 |
| 2018 | $2,727 | $404,200 | $120,600 | $283,600 |
| 2017 | $2,609 | $385,100 | $120,600 | $264,500 |
| 2016 | $2,472 | $342,800 | $120,600 | $222,200 |
| 2015 | $2,416 | $326,600 | $122,900 | $203,700 |
| 2014 | $2,424 | $322,600 | $122,900 | $199,700 |
Source: Public Records
Map
Nearby Homes
- 9288 Winter Berry Dr
- 4902 Pine Laurel Ln
- 4904 Wild Acres Dr
- 9182 Wisteria Way
- 9118 S Wisteria Way
- 9172 S Plume Ct
- 4707 W Granada Hills Ct
- 8854 Rocky Creek Dr
- 8741 S 4870 W
- 5113 W Wood Ranch Dr
- 4572 Bingham Park Dr
- 4887 W 8620 S
- 8787 S Big Bar Ct
- 9734 Glenwood Ln
- 8577 Autumn Gold Cir
- 8851 Humboldt Ct
- 5551 Geronimo Way
- 8767 S Brown Park Dr
- 9353 S 4460 W
- 5582 Washoe Cove
- 5037 W Pine Laurel Ln
- 5023 Pine Laurel Ln
- 5051 Pine Laurel Ln
- 5038 Morning Lily Ln
- 5054 Morning Lily Ln
- 5022 Morning Lily Ln
- 5022 W Morning Lily Ln
- 5061 Pine Laurel Ln
- 5061 W Pine Laurel Ln
- 5007 Pine Laurel Ln
- 5034 Pine Laurel Ln
- 5034 W Pine Laurel Ln
- 5048 Pine Laurel Ln
- 5048 W Pine Laurel Ln
- 5026 Pine Laurel Ln
- 5066 Morning Lily Ln
- 5066 W Morning Lily Ln
- 5008 Morning Lily Ln
- 5058 Pine Laurel Ln
- 5008 Pine Laurel Ln