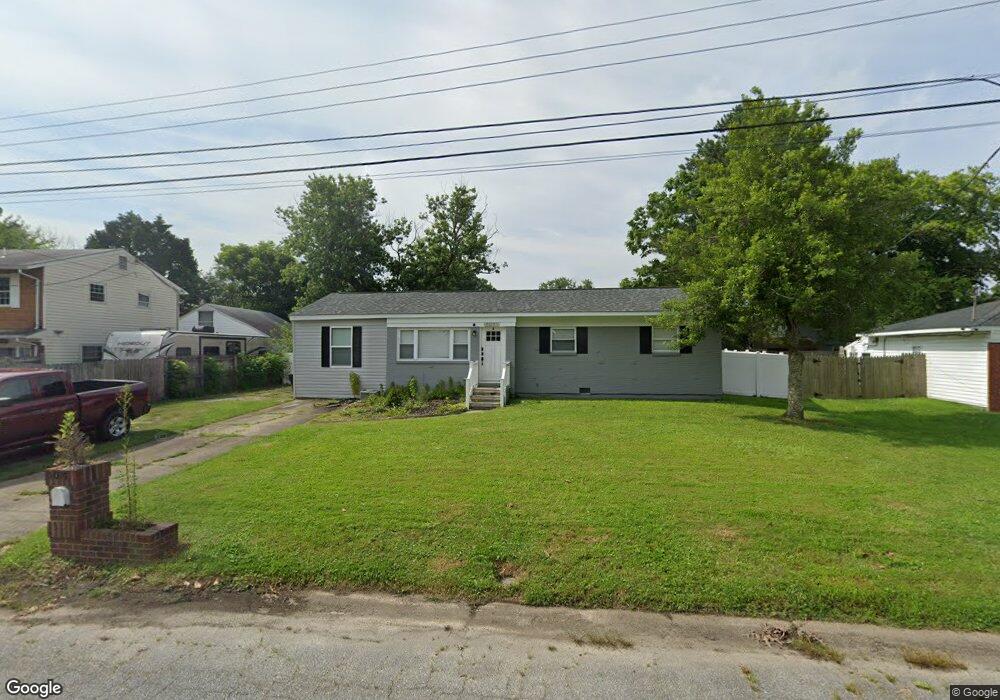
5037 Whitman Ln Virginia Beach, VA 23455
Aragona Village NeighborhoodEstimated Value: $317,000 - $393,000
4
Beds
2
Baths
1,300
Sq Ft
$270/Sq Ft
Est. Value
About This Home
This home is located at 5037 Whitman Ln, Virginia Beach, VA 23455 and is currently estimated at $351,270, approximately $270 per square foot. 5037 Whitman Ln is a home located in Virginia Beach City with nearby schools including Luxford Elementary School, Bayside 6th Grade Campus, and Bayside High School.
Ownership History
Date
Name
Owned For
Owner Type
Purchase Details
Closed on
Jul 12, 2021
Sold by
Peraza Carlos Orlando Acevedo and Peraza Natalie M
Bought by
Marshall Michael A and Marshall Donna M
Current Estimated Value
Home Financials for this Owner
Home Financials are based on the most recent Mortgage that was taken out on this home.
Original Mortgage
$284,900
Outstanding Balance
$258,503
Interest Rate
2.9%
Mortgage Type
VA
Estimated Equity
$92,767
Purchase Details
Closed on
May 8, 2020
Sold by
Equity Trust Company
Bought by
Peraza Carlos Orlando Acevedo and Peraza Natalie M
Home Financials for this Owner
Home Financials are based on the most recent Mortgage that was taken out on this home.
Original Mortgage
$257,796
Interest Rate
3.3%
Mortgage Type
VA
Purchase Details
Closed on
Jan 24, 2020
Sold by
Ane Investments Llc
Bought by
Equity Trust Co and Brian L Hauser Ira
Create a Home Valuation Report for This Property
The Home Valuation Report is an in-depth analysis detailing your home's value as well as a comparison with similar homes in the area
Home Values in the Area
Average Home Value in this Area
Purchase History
| Date | Buyer | Sale Price | Title Company |
|---|---|---|---|
| Marshall Michael A | $275,000 | Fidelity National Ttl Ins Co | |
| Peraza Carlos Orlando Acevedo | $245,000 | Fidelity National Ttl Ins Co | |
| Equity Trust Co | $144,718 | Attorney |
Source: Public Records
Mortgage History
| Date | Status | Borrower | Loan Amount |
|---|---|---|---|
| Open | Marshall Michael A | $284,900 | |
| Previous Owner | Peraza Carlos Orlando Acevedo | $257,796 |
Source: Public Records
Tax History Compared to Growth
Tax History
| Year | Tax Paid | Tax Assessment Tax Assessment Total Assessment is a certain percentage of the fair market value that is determined by local assessors to be the total taxable value of land and additions on the property. | Land | Improvement |
|---|---|---|---|---|
| 2025 | $3,020 | $320,300 | $135,000 | $185,300 |
| 2024 | $3,020 | $311,300 | $135,000 | $176,300 |
| 2023 | $2,907 | $293,600 | $120,000 | $173,600 |
| 2022 | $2,640 | $266,700 | $103,200 | $163,500 |
| 2021 | $2,280 | $230,300 | $79,400 | $150,900 |
| 2020 | $1,607 | $157,900 | $79,400 | $78,500 |
| 2019 | $1,586 | $152,400 | $75,900 | $76,500 |
| 2018 | $1,528 | $152,400 | $75,900 | $76,500 |
| 2017 | $1,528 | $152,400 | $75,900 | $76,500 |
| 2016 | $1,465 | $148,000 | $75,900 | $72,100 |
| 2015 | $1,435 | $144,900 | $75,900 | $69,000 |
| 2014 | -- | $145,700 | $86,300 | $59,400 |
Source: Public Records
Map
Nearby Homes
- 5057 Sullivan Blvd
- 769 Olivieri Ln
- 5024 Hawkins Mill Way
- 740 Farnham Ln
- 841 Brinson Ln
- 5113 Elsie Dr
- 749 Holladay Ln
- 5020 Titian Ln
- 900 Southmoor Dr Unit 103
- 900 Southmoor Dr Unit 105
- 900 Southmoor Dr Unit 205
- 912 Southmoor Dr Unit 303
- 669 Bottino Ln
- 932 Southmoor Dr Unit 203
- 793 Crepe Myrtle Ln
- 5237 Elston Ln
- 5229 Ordsall Place
- 772 Meade Ln
- 5321 Warminster Dr Unit 302
- 5321 Warminster Dr Unit 306
- 5033 Whitman Ln
- 5041 Whitman Ln
- 5040 Sullivan Blvd
- 5036 Sullivan Blvd
- 5044 Sullivan Blvd
- 5040 Whitman Ln
- 5029 Whitman Ln
- 5032 Sullivan Blvd
- 5036 Whitman Ln
- 5028 Sullivan Blvd
- 5040 Westgrove Rd
- 5036 Westgrove Rd
- 5025 Westgrove Rd
- 5044 Paine Ln
- 5025 Whitman Ln
- 5032 Whitman Ln
- 5044 Westgrove Rd
- 5045 Sullivan Blvd
- 5049 Sullivan Blvd
- 5041 Sullivan Blvd