5038 Fallen Oaks Dr Houston, TX 77091
Oak Forest-Garden Oaks NeighborhoodEstimated Value: $490,121 - $594,000
4
Beds
3
Baths
3,358
Sq Ft
$168/Sq Ft
Est. Value
About This Home
This home is located at 5038 Fallen Oaks Dr, Houston, TX 77091 and is currently estimated at $565,780, approximately $168 per square foot. 5038 Fallen Oaks Dr is a home located in Harris County with nearby schools including Clifton Middle, Scarborough High School, and Southwest Schools Mangum El Campus.
Ownership History
Date
Name
Owned For
Owner Type
Purchase Details
Closed on
Jan 25, 2015
Sold by
Korb Stephanie Anne
Bought by
Korb Eric S
Current Estimated Value
Purchase Details
Closed on
Jul 21, 2007
Sold by
Davis Shawn P and Harding David H
Bought by
Korb Stephanie Anne and Korb Eric Steven
Home Financials for this Owner
Home Financials are based on the most recent Mortgage that was taken out on this home.
Original Mortgage
$198,500
Outstanding Balance
$125,423
Interest Rate
6.71%
Mortgage Type
Purchase Money Mortgage
Estimated Equity
$440,357
Purchase Details
Closed on
Jul 31, 2006
Sold by
Kadlubar R John and Kadlubar Rhonda
Bought by
Davis Shawn P and Harding David H
Home Financials for this Owner
Home Financials are based on the most recent Mortgage that was taken out on this home.
Original Mortgage
$153,600
Interest Rate
6.66%
Mortgage Type
Purchase Money Mortgage
Purchase Details
Closed on
Mar 27, 2006
Sold by
Grantom Mark S and Estate Of Gary M Hess
Bought by
Kadlubar R John
Create a Home Valuation Report for This Property
The Home Valuation Report is an in-depth analysis detailing your home's value as well as a comparison with similar homes in the area
Home Values in the Area
Average Home Value in this Area
Purchase History
| Date | Buyer | Sale Price | Title Company |
|---|---|---|---|
| Korb Eric S | -- | None Available | |
| Korb Stephanie Anne | -- | American Title Co | |
| Davis Shawn P | -- | Etc | |
| Kadlubar R John | -- | Partners Title Company |
Source: Public Records
Mortgage History
| Date | Status | Borrower | Loan Amount |
|---|---|---|---|
| Open | Korb Stephanie Anne | $198,500 | |
| Previous Owner | Davis Shawn P | $153,600 |
Source: Public Records
Tax History Compared to Growth
Tax History
| Year | Tax Paid | Tax Assessment Tax Assessment Total Assessment is a certain percentage of the fair market value that is determined by local assessors to be the total taxable value of land and additions on the property. | Land | Improvement |
|---|---|---|---|---|
| 2025 | $4,686 | $384,510 | $128,971 | $255,539 |
| 2024 | $4,686 | $331,245 | $128,971 | $202,274 |
| 2023 | $4,686 | $342,781 | $113,798 | $228,983 |
| 2022 | $6,941 | $319,242 | $113,798 | $205,444 |
| 2021 | $6,679 | $286,586 | $75,865 | $210,721 |
| 2020 | $6,619 | $273,321 | $75,865 | $197,456 |
| 2019 | $7,168 | $283,270 | $75,865 | $207,405 |
| 2018 | $5,050 | $263,072 | $75,865 | $187,207 |
| 2017 | $7,110 | $281,199 | $75,865 | $205,334 |
| 2016 | $6,697 | $285,009 | $75,865 | $209,144 |
| 2015 | $4,346 | $254,151 | $75,865 | $178,286 |
| 2014 | $4,346 | $225,952 | $53,106 | $172,846 |
Source: Public Records
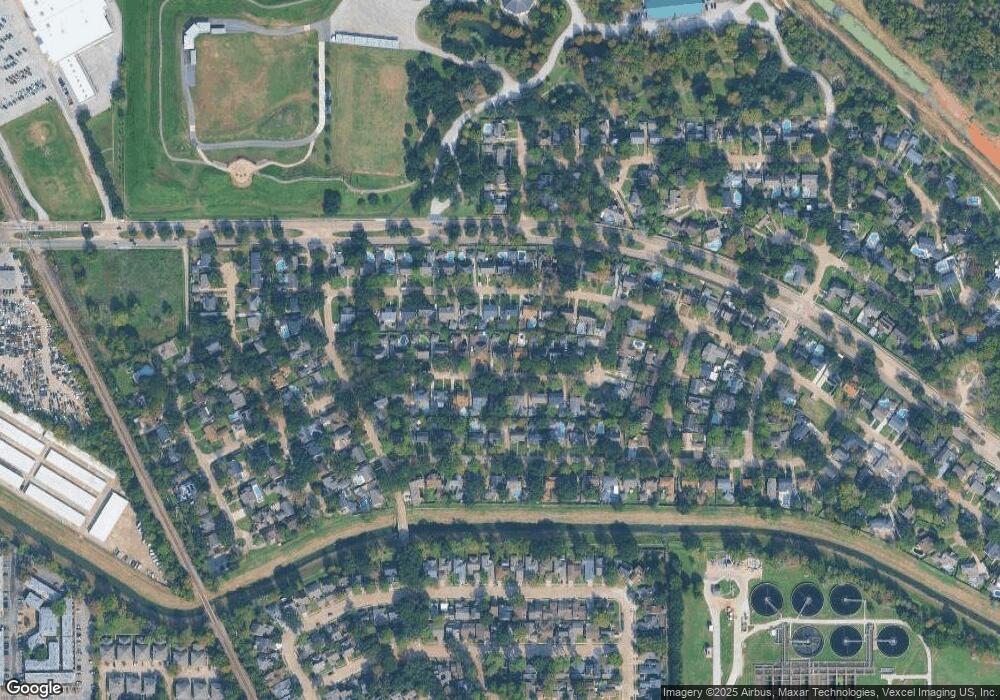
Map
Nearby Homes
- 5010 Oak Shadows Dr
- 5610 Oak Trail Ln
- 5511 Oak Trail Ln
- 4906 Droddy St
- 5451 Oakhaven Ln
- 5670 Birchmont Dr Unit C
- 5036 Golden Forest Dr
- 5114 Golden Forest Dr Unit B
- 5018 Golden Forest Dr
- 5016 Golden Forest Dr
- 5014 Golden Forest Dr
- 5013 Golden Forest Dr
- 5036 Creekmont Dr
- 5116 Creekmont Dr
- 5662 Birchmont Dr Unit A
- 4923 Golden Forest Dr
- 4923 Golden Forest Dr Unit A
- 5666 Birchmont Dr Unit 3
- 4702 Bayou Vista Dr
- 5019 Creekmont Dr
- 5042 Fallen Oaks Dr
- 5034 Fallen Oaks Dr
- 5027 Bayou Vista Dr
- 5030 Fallen Oaks Dr
- 5046 Fallen Oaks Dr
- 5019 Bayou Vista Dr
- 5031 Bayou Vista Dr
- 5039 Fallen Oaks Dr
- 5043 Fallen Oaks Dr
- 5035 Fallen Oaks Dr
- 5050 Fallen Oaks Dr
- 5026 Fallen Oaks Dr
- 5035 Bayou Vista Dr
- 5031 Fallen Oaks Dr
- 5047 Fallen Oaks Dr
- 5007 Bayou Vista Dr
- 5027 Fallen Oaks Dr
- 5051 Fallen Oaks Dr
- 5039 Bayou Vista Dr
- 5054 Fallen Oaks Dr