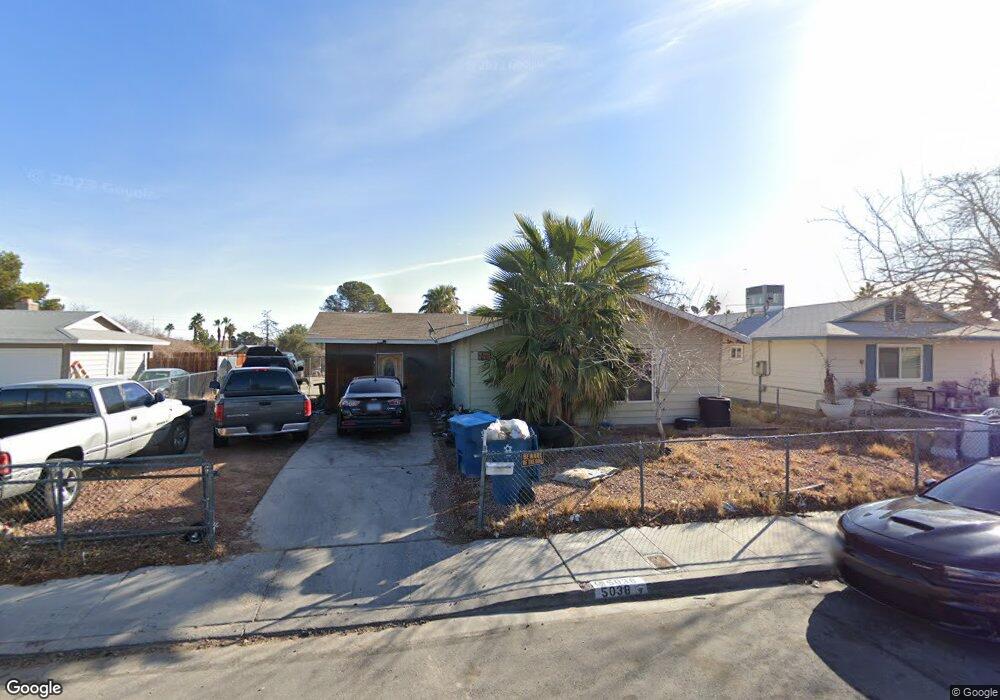
5038 Killarney St Las Vegas, NV 89122
Estimated Value: $261,000 - $325,000
2
Beds
1
Bath
912
Sq Ft
$327/Sq Ft
Est. Value
About This Home
This home is located at 5038 Killarney St, Las Vegas, NV 89122 and is currently estimated at $298,363, approximately $327 per square foot. 5038 Killarney St is a home located in Clark County with nearby schools including Harley Harmon Elementary School, Francis H Cortney Junior High School, and Del Sol Academy of the Performing Arts.
Ownership History
Date
Name
Owned For
Owner Type
Purchase Details
Closed on
Aug 23, 2006
Sold by
Morales Esperanza
Bought by
Morales Angel M
Current Estimated Value
Home Financials for this Owner
Home Financials are based on the most recent Mortgage that was taken out on this home.
Original Mortgage
$150,000
Outstanding Balance
$90,058
Interest Rate
6.76%
Mortgage Type
New Conventional
Estimated Equity
$208,305
Purchase Details
Closed on
Mar 21, 2003
Sold by
Morales Esperanza
Bought by
Morales Angel M
Home Financials for this Owner
Home Financials are based on the most recent Mortgage that was taken out on this home.
Original Mortgage
$88,000
Interest Rate
5.54%
Purchase Details
Closed on
Dec 15, 1999
Sold by
Walton James H and Walton Hope L
Bought by
Morales Angel M
Home Financials for this Owner
Home Financials are based on the most recent Mortgage that was taken out on this home.
Original Mortgage
$85,868
Interest Rate
7.82%
Mortgage Type
FHA
Create a Home Valuation Report for This Property
The Home Valuation Report is an in-depth analysis detailing your home's value as well as a comparison with similar homes in the area
Home Values in the Area
Average Home Value in this Area
Purchase History
| Date | Buyer | Sale Price | Title Company |
|---|---|---|---|
| Morales Angel M | -- | Old Republic Title Co Of Nv | |
| Morales Angel M | -- | Fidelity National Title | |
| Morales Angel M | $86,000 | National Title Company |
Source: Public Records
Mortgage History
| Date | Status | Borrower | Loan Amount |
|---|---|---|---|
| Open | Morales Angel M | $150,000 | |
| Closed | Morales Angel M | $88,000 | |
| Closed | Morales Angel M | $85,868 | |
| Closed | Morales Angel M | $16,500 |
Source: Public Records
Tax History Compared to Growth
Tax History
| Year | Tax Paid | Tax Assessment Tax Assessment Total Assessment is a certain percentage of the fair market value that is determined by local assessors to be the total taxable value of land and additions on the property. | Land | Improvement |
|---|---|---|---|---|
| 2025 | $713 | $40,371 | $27,300 | $13,071 |
| 2024 | $661 | $40,371 | $27,300 | $13,071 |
| 2023 | $692 | $41,903 | $29,400 | $12,503 |
| 2022 | $612 | $34,900 | $23,100 | $11,800 |
| 2021 | $567 | $33,237 | $21,700 | $11,537 |
| 2020 | $524 | $29,992 | $18,200 | $11,792 |
| 2019 | $491 | $28,713 | $16,800 | $11,913 |
| 2018 | $469 | $26,775 | $15,050 | $11,725 |
| 2017 | $777 | $26,483 | $14,350 | $12,133 |
| 2016 | $692 | $20,091 | $7,350 | $12,741 |
| 2015 | $631 | $19,292 | $7,350 | $11,942 |
| 2014 | $558 | $14,819 | $4,550 | $10,269 |
Source: Public Records
Map
Nearby Homes
- 5068 Killarney St
- 5122 Gregg Place
- 5022 Carmel Ave Unit 3
- 5284 Wellesley Ave
- 4990 Denning St
- 5289 Chattanooga Ave
- 4808 Everman Dr
- 5030 E Hacienda Ave
- 4945 Rita Dr
- 5359 Chattanooga Ave
- 5155 Saratoga Dr
- 4944 Rita Dr
- 5200 Blanton Dr
- 4999 Nellis Cir
- 4805 Terra Linda Ave
- 5149 Sun Valley Dr
- 5225 Saratoga Dr
- 5251 Tipper Ave
- 5093 Sun Valley Dr
- 5249 Sun Valley Dr
- 5028 Killarney St
- 5048 Killarney St
- 5037 Morris St
- 5045 Morris St
- 5020 Killarney St
- 5058 Killarney St
- 5027 Morris St
- 5055 Morris St
- 5035 Killarney St
- 5045 Killarney St
- 5019 Morris St
- 5063 Morris St
- 5055 Killarney St
- 5010 Killarney St
- 5152 Airdrie Place
- 5143 Airdrie Place
- 5009 Morris St
- 5073 Morris St
- 5165 Carmel Ave Unit 4
- 5138 Carmel Ave