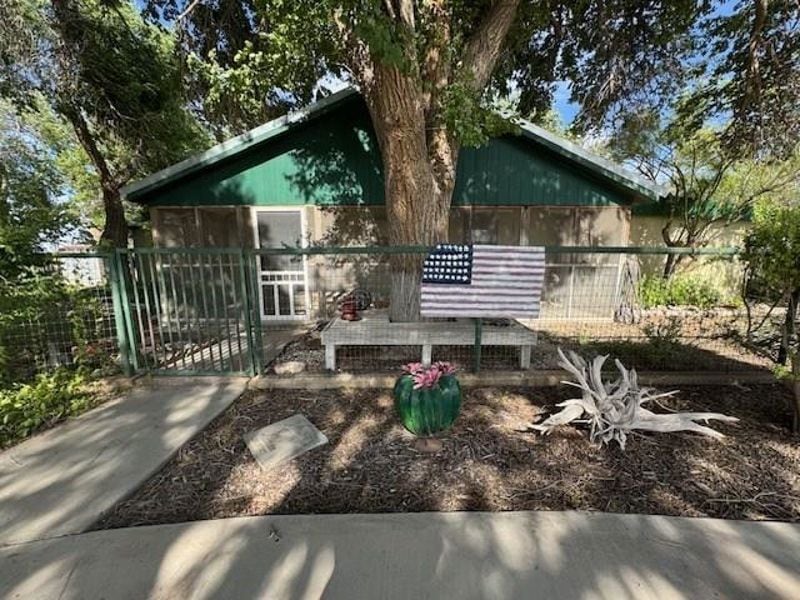
5038 N Sullivan Rd Fort Stockton, TX 79735
Estimated payment $3,394/month
Total Views
5,109
3
Beds
2
Baths
1,596
Sq Ft
$360
Price per Sq Ft
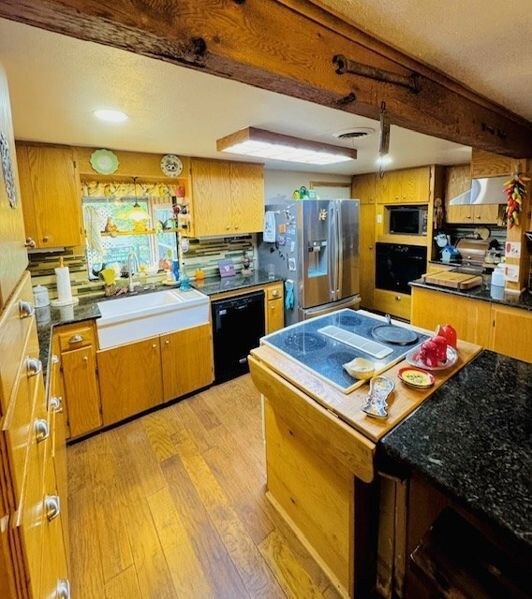
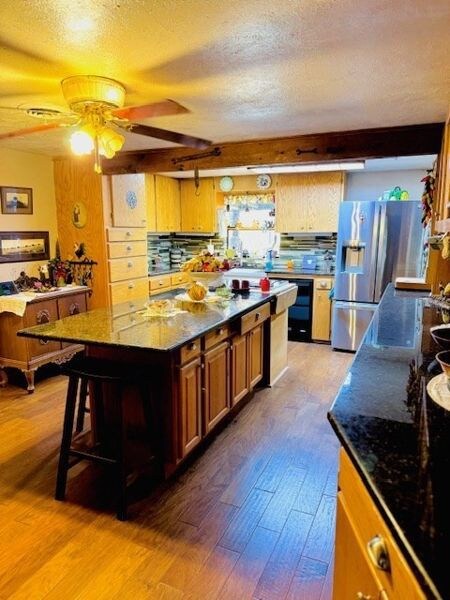
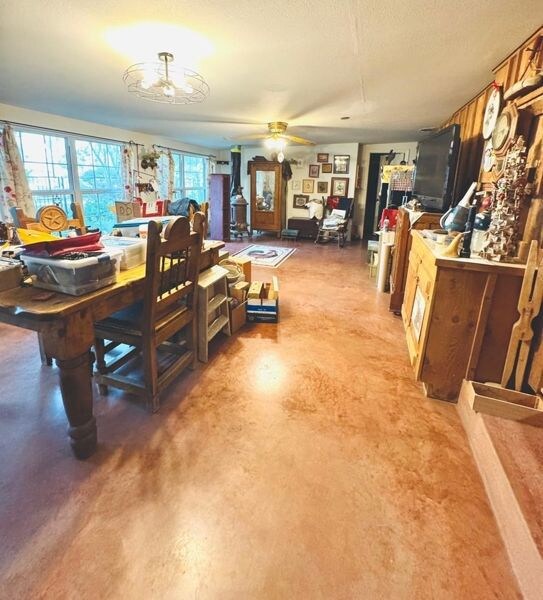
About This Home
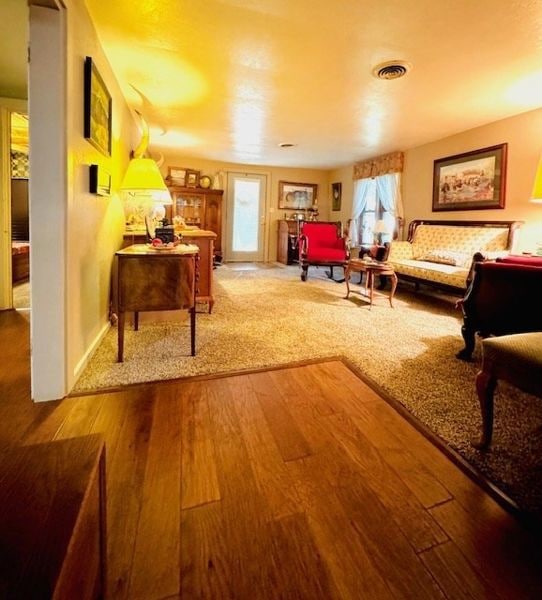
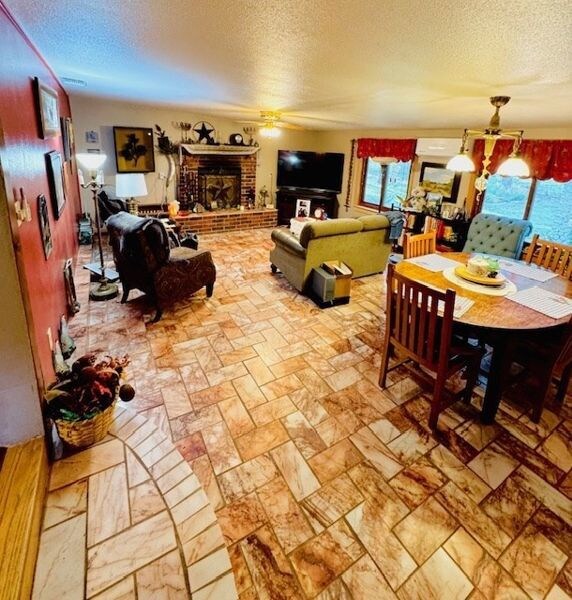
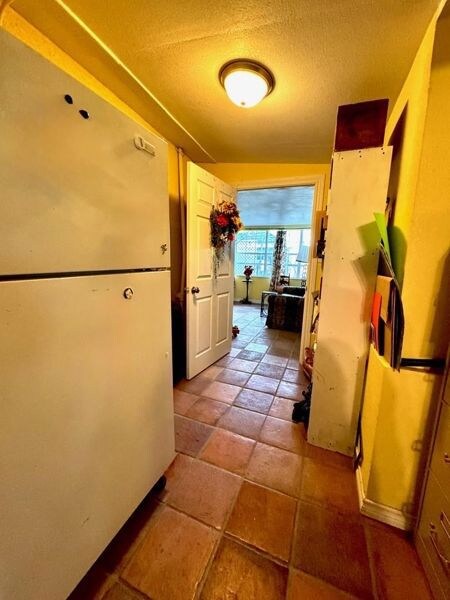
THIS IS THE ULTIMATE DREAM. SO MUCH TO LIST...HORSE, TOOL & HAY BARNS PLUS GARAGE. IRRIGATION WELLS. 10.5 ACRES-FENCED, CROSS FENCED-SPRINKLER SYSTEM-AUTO & MANUEL. THERE IS APPROXIMATELY 10 ACRES WITH FLOOD IRRIGATION SYSTEM INTACT AND READY TO USE. HISTORICALLY, WATER USE GUARANTEES ENOUGH WATER TO RAISE ALFALFA OR OTHER CROPS IN ADDITION TO WATER SUPPLY FOR THE TWO ORCHARDS! BEAUTIFUL 3-2 HOME, WELL MAINTAINED. 20 PECAN TREES AND AN ABUNDANCE OF FRUIT TREES. SCHEDULE YOUR PRIVATE SHOWING TODAY!
Listing Provided By

Home Details
Home Type
- Single Family
Est. Annual Taxes
- $4,293
Bedrooms and Bathrooms
- 3 Bedrooms
- 2 Full Bathrooms
Additional Features
- Potential uses include agriculture, equine, orchards/vineyards, residential single, hobby farm
- Horses Allowed On Property
- Well
Map
Create a Home Valuation Report for This Property
The Home Valuation Report is an in-depth analysis detailing your home's value as well as a comparison with similar homes in the area
Home Values in the Area
Average Home Value in this Area
Tax History
| Year | Tax Paid | Tax Assessment Tax Assessment Total Assessment is a certain percentage of the fair market value that is determined by local assessors to be the total taxable value of land and additions on the property. | Land | Improvement |
|---|---|---|---|---|
| 2025 | $4,293 | $196,100 | $4,000 | $192,100 |
| 2024 | $4,076 | $193,170 | $4,000 | $189,170 |
| 2023 | $3,439 | $184,640 | $4,000 | $180,640 |
| 2022 | $2,649 | $185,240 | $4,000 | $181,240 |
| 2021 | $2,678 | $139,880 | $4,000 | $135,880 |
| 2020 | $2,541 | $128,080 | $4,000 | $124,080 |
| 2019 | $2,422 | $116,130 | $3,120 | $113,010 |
| 2018 | $2,340 | $110,790 | $3,120 | $107,670 |
| 2017 | $2,180 | $102,650 | $3,120 | $99,530 |
| 2016 | $2,075 | $97,990 | $3,120 | $94,870 |
| 2015 | -- | $97,990 | $3,120 | $94,870 |
| 2014 | -- | $92,030 | $3,120 | $88,910 |
Source: Public Records
Property History
| Date | Event | Price | List to Sale | Price per Sq Ft |
|---|---|---|---|---|
| 10/06/2025 10/06/25 | For Sale | $575,000 | -- | $360 / Sq Ft |
Nearby Homes
- 5050 N Sullivan Rd
- 725 E 48th Ln
- 722 E 48th Ln
- 193 E 46th Ln
- 0 51st St Unit 50084536
- 326 W 48th Ln
- NA E 50th Ln
- 5183 Texas 18
- 5457 Texas 18
- 264 E 44th Ln
- NA Blaydes Ln
- TBD W 55th Ln
- 4082 Saint Gall
- 4795 N Gonzalez Rd
- 239 W 41st Ln
- 1913 W 55th Ln
- 0 Alexander Ln
- 1373 W Belanger St
- 0 Interstate 10
- 0000 Interstate 10