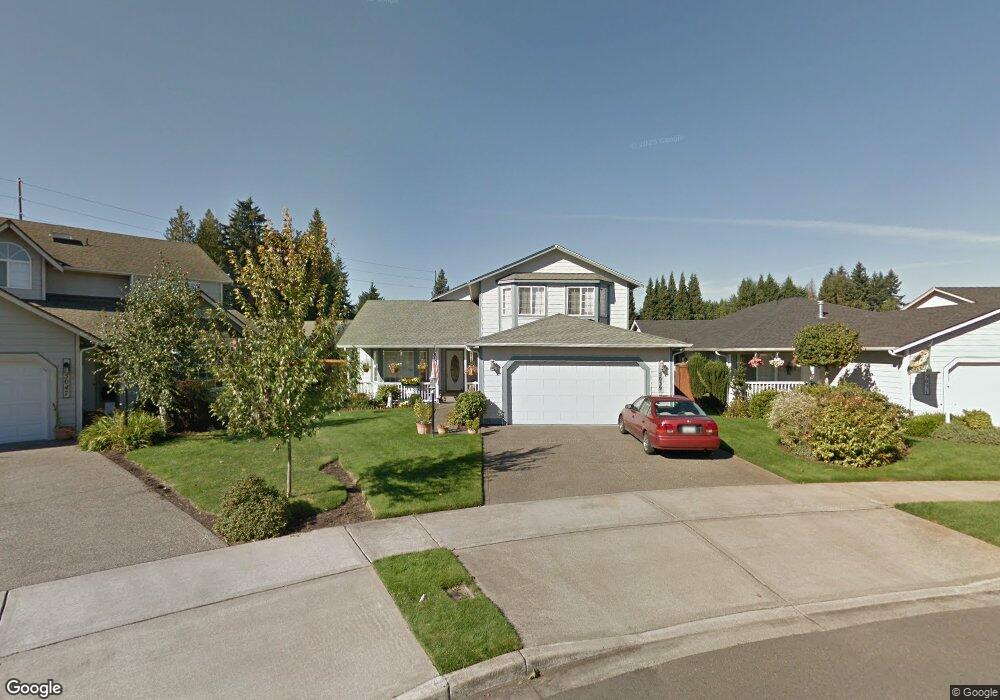
5039 Siskiyou Loop SE Olympia, WA 98501
Wilderness NeighborhoodEstimated Value: $609,622 - $635,000
--
Bed
3
Baths
2,315
Sq Ft
$269/Sq Ft
Est. Value
About This Home
This home is located at 5039 Siskiyou Loop SE, Olympia, WA 98501 and is currently estimated at $622,906, approximately $269 per square foot. 5039 Siskiyou Loop SE is a home located in Thurston County with nearby schools including Centennial Elementary School, Washington Middle School, and Olympia High School.
Ownership History
Date
Name
Owned For
Owner Type
Purchase Details
Closed on
Jul 5, 2017
Sold by
Hosier Kevin Glenn and Hosier Amber Rae
Bought by
Adam Kindal J and Adam Brandon J
Current Estimated Value
Home Financials for this Owner
Home Financials are based on the most recent Mortgage that was taken out on this home.
Original Mortgage
$299,250
Outstanding Balance
$248,967
Interest Rate
3.94%
Mortgage Type
New Conventional
Estimated Equity
$373,939
Purchase Details
Closed on
Jul 23, 2001
Sold by
Deering & Nelson Inc
Bought by
Hosier Kevin G and Hosier Amber Rae
Home Financials for this Owner
Home Financials are based on the most recent Mortgage that was taken out on this home.
Original Mortgage
$202,929
Interest Rate
7.15%
Mortgage Type
VA
Purchase Details
Closed on
Jun 15, 2000
Sold by
Hilden Robert D and Hilden Ardith M
Bought by
Deering & Nelson Inc
Create a Home Valuation Report for This Property
The Home Valuation Report is an in-depth analysis detailing your home's value as well as a comparison with similar homes in the area
Home Values in the Area
Average Home Value in this Area
Purchase History
| Date | Buyer | Sale Price | Title Company |
|---|---|---|---|
| Adam Kindal J | $314,719 | Thurston County Title Co | |
| Hosier Kevin G | $198,950 | Transnation Title Insurance | |
| Deering & Nelson Inc | -- | First American Title Ins Co |
Source: Public Records
Mortgage History
| Date | Status | Borrower | Loan Amount |
|---|---|---|---|
| Open | Adam Kindal J | $299,250 | |
| Previous Owner | Hosier Kevin G | $202,929 |
Source: Public Records
Tax History Compared to Growth
Tax History
| Year | Tax Paid | Tax Assessment Tax Assessment Total Assessment is a certain percentage of the fair market value that is determined by local assessors to be the total taxable value of land and additions on the property. | Land | Improvement |
|---|---|---|---|---|
| 2024 | $5,229 | $571,600 | $137,700 | $433,900 |
| 2023 | $5,229 | $499,500 | $128,500 | $371,000 |
| 2022 | $4,892 | $514,900 | $100,200 | $414,700 |
| 2021 | $4,381 | $415,300 | $82,500 | $332,800 |
| 2020 | $4,254 | $342,400 | $87,900 | $254,500 |
| 2019 | $3,729 | $324,700 | $76,500 | $248,200 |
| 2018 | $3,712 | $274,800 | $61,500 | $213,300 |
| 2017 | $3,492 | $267,700 | $63,600 | $204,100 |
| 2016 | $3,305 | $255,950 | $55,250 | $200,700 |
| 2014 | -- | $245,750 | $55,250 | $190,500 |
Source: Public Records
Map
Nearby Homes
- 4932 Siskiyou Loop SE
- 4704 Cole Ct SE
- 2745 45th Ave SE
- 2427 Boulevard Heights Loop SE
- 2433 55th Ave SE
- 2835 60th Ln SE Unit A
- 5113 Brassfield Dr SE
- 4019 Wexford Loop SE
- 3324 51st Ct SE
- 3820 Kingsbury Ln SE
- 3804 Reading St SE
- 3525 Humphrey St SE
- 3502 40th Ave SE
- 5505 Windemere Dr SE
- 5506 Windemere Dr SE
- 5102 Donnelly Dr SE
- 3701 Kinsale Ln SE
- 3715 Holiday Dr SE
- 4010 Henderson Blvd SE
- 3712 Kinsale Ln SE
- 5047 Siskiyou Loop SE
- 5031 Siskiyou Loop SE
- 4828 Stratford Ln SE Unit 4828
- 5023 Siskiyou Loop SE
- 4826 Stratford Ln SE
- 5101 Siskiyou Loop SE
- 4824 Stratford Ln SE Unit 4824
- 4822 Stratford Ln SE Unit 4822
- 4832 Stratford Ln SE Unit 4832
- 5034 Siskiyou Loop SE
- 5017 Siskiyou Loop SE
- 5109 Siskiyou Loop SE
- 4830 Stratford Ln SE Unit 4830
- 4820 Stratford Ln SE
- 5040 Siskiyou Loop SE
- 5115 Siskiyou Loop SE
- 5009 Siskiyou Loop SE
- 5018 Siskiyou Loop SE
- 4818 Stratford Ln SE Unit 4818
- 5121 Siskiyou Loop SE