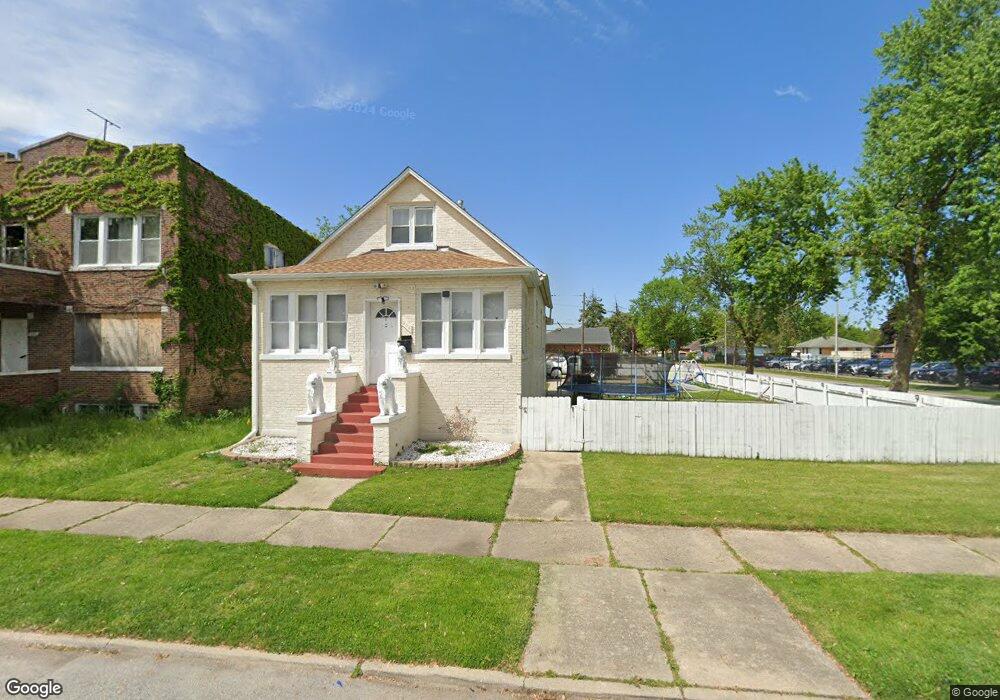
504 157th St Calumet City, IL 60409
Estimated Value: $102,000 - $181,000
2
Beds
1
Bath
805
Sq Ft
$176/Sq Ft
Est. Value
About This Home
This home is located at 504 157th St, Calumet City, IL 60409 and is currently estimated at $141,923, approximately $176 per square foot. 504 157th St is a home located in Cook County with nearby schools including Lincoln Elementary School, Thornton Fractional North High School, and Hammond Academy Of Science & Tech.
Ownership History
Date
Name
Owned For
Owner Type
Purchase Details
Closed on
Dec 4, 2023
Sold by
Rodriguez Alberto and Rodriguez Veronica
Bought by
Juarez Alberto Rodriguez and Ortiz Veronica
Current Estimated Value
Purchase Details
Closed on
Nov 17, 2017
Sold by
Illinois Housing Development Authority
Bought by
Rodriguez Albert
Purchase Details
Closed on
Mar 27, 2017
Sold by
Orona Geiacio and Orona Gelacio
Bought by
Illinois Housing Development Authority
Purchase Details
Closed on
Mar 19, 2007
Sold by
Mecha Gertrude M
Bought by
Orona Geiacio and Orona Maria
Home Financials for this Owner
Home Financials are based on the most recent Mortgage that was taken out on this home.
Original Mortgage
$92,635
Interest Rate
6.31%
Mortgage Type
Purchase Money Mortgage
Purchase Details
Closed on
Dec 15, 2006
Sold by
Chicago Title Land Trust Co
Bought by
Mecha Gertrude
Create a Home Valuation Report for This Property
The Home Valuation Report is an in-depth analysis detailing your home's value as well as a comparison with similar homes in the area
Home Values in the Area
Average Home Value in this Area
Purchase History
| Date | Buyer | Sale Price | Title Company |
|---|---|---|---|
| Juarez Alberto Rodriguez | -- | None Listed On Document | |
| Rodriguez Albert | -- | Fidelity National Title | |
| Illinois Housing Development Authority | -- | None Available | |
| Orona Geiacio | $95,500 | Attorneys Title Guaranty Fun | |
| Mecha Gertrude | -- | None Available |
Source: Public Records
Mortgage History
| Date | Status | Borrower | Loan Amount |
|---|---|---|---|
| Previous Owner | Orona Geiacio | $92,635 |
Source: Public Records
Tax History Compared to Growth
Tax History
| Year | Tax Paid | Tax Assessment Tax Assessment Total Assessment is a certain percentage of the fair market value that is determined by local assessors to be the total taxable value of land and additions on the property. | Land | Improvement |
|---|---|---|---|---|
| 2024 | $4,250 | $11,000 | $1,220 | $9,780 |
| 2023 | $2,215 | $11,000 | $1,220 | $9,780 |
| 2022 | $2,215 | $6,481 | $1,068 | $5,413 |
| 2021 | $2,327 | $6,480 | $1,067 | $5,413 |
| 2020 | $2,327 | $6,480 | $1,067 | $5,413 |
| 2019 | $1,856 | $5,997 | $991 | $5,006 |
| 2018 | $4,273 | $5,997 | $991 | $5,006 |
| 2017 | $1,800 | $5,997 | $991 | $5,006 |
| 2016 | $2,162 | $5,840 | $915 | $4,925 |
| 2015 | $2,008 | $5,840 | $915 | $4,925 |
| 2014 | $2,040 | $5,840 | $915 | $4,925 |
| 2013 | $1,865 | $5,922 | $915 | $5,007 |
Source: Public Records
Map
Nearby Homes