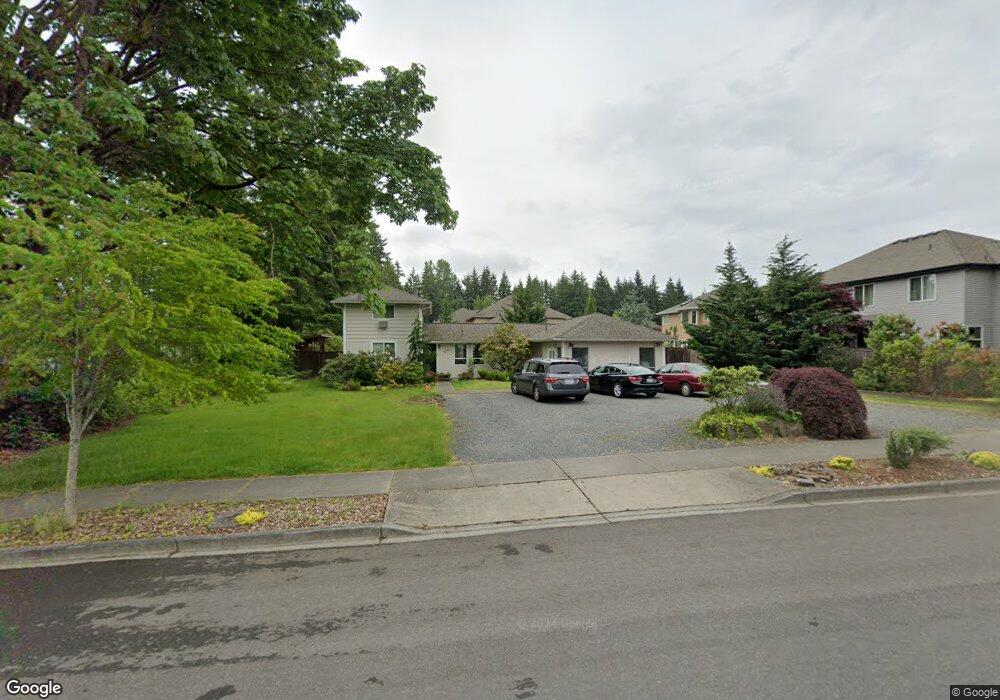
504 224th St SW Bothell, WA 98021
Queensborough-Brentwood NeighborhoodEstimated Value: $734,000 - $862,000
3
Beds
3
Baths
1,770
Sq Ft
$464/Sq Ft
Est. Value
About This Home
This home is located at 504 224th St SW, Bothell, WA 98021 and is currently estimated at $821,054, approximately $463 per square foot. 504 224th St SW is a home located in Snohomish County with nearby schools including Frank Love Elementary School, Kenmore Middle School, and Bothell High School.
Ownership History
Date
Name
Owned For
Owner Type
Purchase Details
Closed on
Jul 12, 2017
Sold by
Rettig Jeffrey D
Bought by
Rettig Jeffrey D and Barham Melissa B
Current Estimated Value
Home Financials for this Owner
Home Financials are based on the most recent Mortgage that was taken out on this home.
Original Mortgage
$259,500
Outstanding Balance
$177,314
Interest Rate
3.94%
Mortgage Type
New Conventional
Estimated Equity
$643,740
Purchase Details
Closed on
May 8, 2009
Sold by
Sharpe Gene Stanley and Sharpe Ray Allen
Bought by
Rettig Jeffrey D
Home Financials for this Owner
Home Financials are based on the most recent Mortgage that was taken out on this home.
Original Mortgage
$265,059
Interest Rate
4.71%
Mortgage Type
FHA
Purchase Details
Closed on
May 11, 2004
Sold by
Mcneilly Michael Leroy and Mcneilly Michael L
Bought by
Community Development Llc
Purchase Details
Closed on
Aug 4, 1997
Sold by
Sharpe L Kathleen
Bought by
Sharpe Dale R
Create a Home Valuation Report for This Property
The Home Valuation Report is an in-depth analysis detailing your home's value as well as a comparison with similar homes in the area
Home Values in the Area
Average Home Value in this Area
Purchase History
| Date | Buyer | Sale Price | Title Company |
|---|---|---|---|
| Rettig Jeffrey D | -- | Stewart Title Company | |
| Rettig Jeffrey D | $269,950 | Chicago Title | |
| Community Development Llc | $400,000 | Chicago Title Insurance Co | |
| Community Development Llc | $210,600 | Chicago Title Insurance Co | |
| Sharpe Dale R | -- | -- |
Source: Public Records
Mortgage History
| Date | Status | Borrower | Loan Amount |
|---|---|---|---|
| Open | Rettig Jeffrey D | $259,500 | |
| Closed | Rettig Jeffrey D | $265,059 |
Source: Public Records
Tax History
| Year | Tax Paid | Tax Assessment Tax Assessment Total Assessment is a certain percentage of the fair market value that is determined by local assessors to be the total taxable value of land and additions on the property. | Land | Improvement |
|---|---|---|---|---|
| 2025 | $5,026 | $673,200 | $529,900 | $143,300 |
| 2024 | $5,026 | $585,200 | $446,900 | $138,300 |
| 2023 | $6,058 | $777,400 | $626,600 | $150,800 |
| 2022 | $5,476 | $566,600 | $438,600 | $128,000 |
| 2020 | $4,401 | $419,800 | $311,400 | $108,400 |
| 2019 | $3,957 | $390,400 | $281,300 | $109,100 |
| 2018 | $3,633 | $344,700 | $247,400 | $97,300 |
| 2017 | $2,941 | $280,100 | $194,000 | $86,100 |
| 2016 | $2,575 | $252,300 | $169,800 | $82,500 |
Source: Public Records
Map
Nearby Homes
- 308 225th St SW
- 422 216th St SW
- 22709 12th Place W
- 22827 Meridian Ave S
- 625 215th St SW
- 410 214th St SW Unit B
- 23318 3rd Place W
- 18 232nd Place SW
- 17 232nd Place SE
- 22213 17th Ave W
- 21723 3rd Ave SE
- 604 213th St SW
- 22226 17th Ave W
- 21414 2nd Ave SE
- 33 213th Place SW
- 23619 5th Ave W
- 931 236th Place SW
- 19924 7th Dr SE
- 20026 7th Dr SE
- 20021 7th Dr SE
- 22405 5th Place W
- 22417 5th Place W
- 22411 5th Place W
- 22423 5th Place W
- 505 224th St SW
- 431 224th St SW
- 22415 5th Place W
- 513 224th St SW
- 22404 5th Place W
- 22429 5th Place W
- 22410 5th Place W
- 22416 5th Place W
- 504 223rd St SW
- 22325 4th Place W
- 22316 4th Place W
- 420 224th St SW
- 22422 5th Place W
- 22503 5th Place W
- 22507 5th Place W
- 22409 6th Place W
Your Personal Tour Guide
Ask me questions while you tour the home.