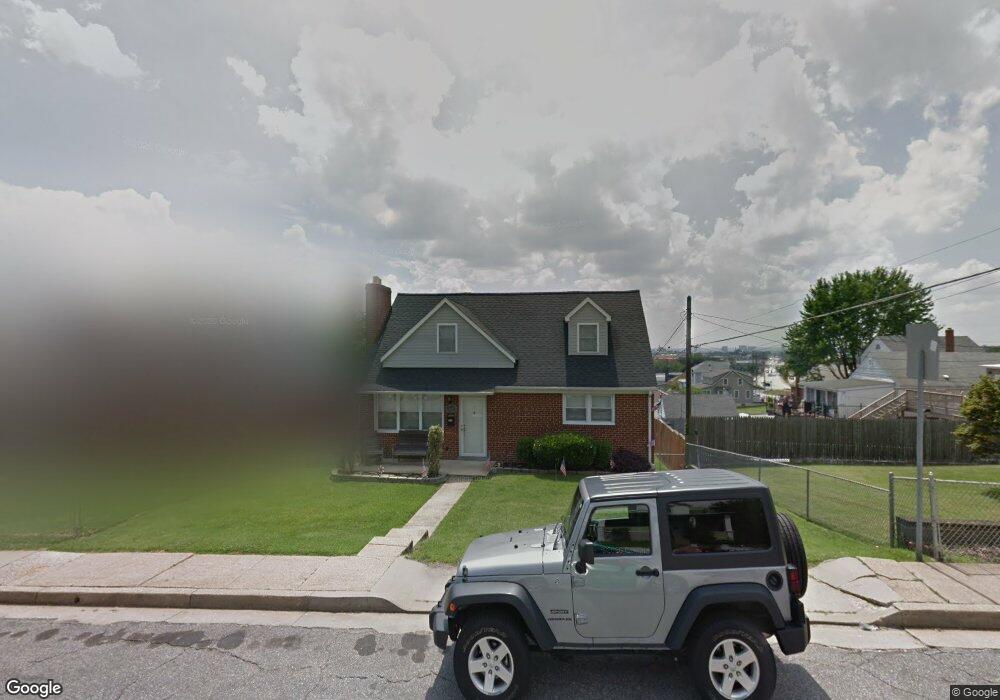
504 47th St Baltimore, MD 21224
Estimated Value: $234,000 - $336,000
Studio
2
Baths
1,428
Sq Ft
$208/Sq Ft
Est. Value
About This Home
This home is located at 504 47th St, Baltimore, MD 21224 and is currently estimated at $297,470, approximately $208 per square foot. 504 47th St is a home located in Baltimore County with nearby schools including Norwood Elementary School, Holabird Middle School, and Dundalk High School.
Ownership History
Date
Name
Owned For
Owner Type
Purchase Details
Closed on
Jun 29, 2001
Sold by
Secretary Of Housing
Bought by
Galloway Daniel G
Current Estimated Value
Purchase Details
Closed on
Dec 11, 2000
Sold by
Dunkerly William R
Bought by
Secretary Of Housing
Purchase Details
Closed on
Mar 3, 1994
Sold by
Wehaidy Wehaidy N
Bought by
Dunkerly William R
Home Financials for this Owner
Home Financials are based on the most recent Mortgage that was taken out on this home.
Original Mortgage
$106,150
Interest Rate
7.01%
Create a Home Valuation Report for This Property
The Home Valuation Report is an in-depth analysis detailing your home's value as well as a comparison with similar homes in the area
Home Values in the Area
Average Home Value in this Area
Purchase History
| Date | Buyer | Sale Price | Title Company |
|---|---|---|---|
| Galloway Daniel G | $89,000 | -- | |
| Secretary Of Housing | $112,025 | -- | |
| Dunkerly William R | $105,500 | -- |
Source: Public Records
Mortgage History
| Date | Status | Borrower | Loan Amount |
|---|---|---|---|
| Previous Owner | Dunkerly William R | $106,150 |
Source: Public Records
Tax History
| Year | Tax Paid | Tax Assessment Tax Assessment Total Assessment is a certain percentage of the fair market value that is determined by local assessors to be the total taxable value of land and additions on the property. | Land | Improvement |
|---|---|---|---|---|
| 2025 | $3,749 | $242,033 | -- | -- |
| 2024 | $3,749 | $224,667 | -- | -- |
| 2023 | $3,360 | $207,300 | $62,000 | $145,300 |
| 2022 | $3,544 | $199,733 | $0 | $0 |
| 2021 | $2,728 | $192,167 | $0 | $0 |
| 2020 | $2,728 | $184,600 | $62,000 | $122,600 |
| 2019 | $2,689 | $184,600 | $62,000 | $122,600 |
| 2018 | $2,940 | $184,600 | $62,000 | $122,600 |
| 2017 | $3,361 | $187,300 | $0 | $0 |
| 2016 | $3,326 | $182,833 | $0 | $0 |
| 2015 | $3,326 | $178,367 | $0 | $0 |
| 2014 | $3,326 | $173,900 | $0 | $0 |
Source: Public Records
Map
Nearby Homes
Your Personal Tour Guide
Ask me questions while you tour the home.