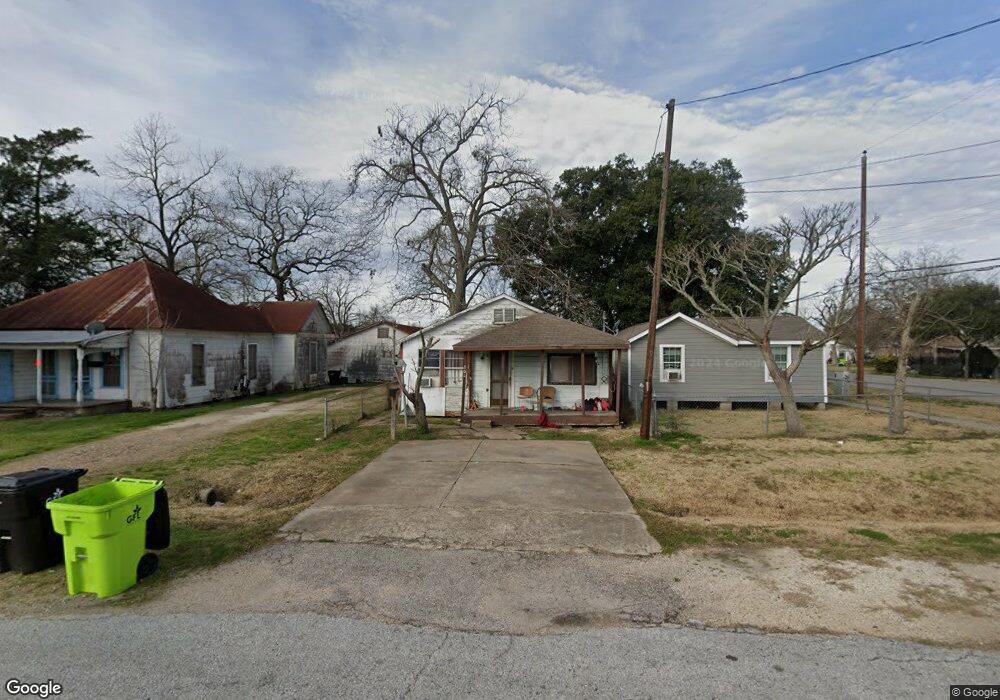
504 4th St Rosenberg, TX 77471
Estimated Value: $114,010 - $188,000
2
Beds
1
Bath
800
Sq Ft
$182/Sq Ft
Est. Value
About This Home
This home is located at 504 4th St, Rosenberg, TX 77471 and is currently estimated at $145,753, approximately $182 per square foot. 504 4th St is a home located in Fort Bend County with nearby schools including Jackson Elementary School, George Junior High School, and B.F. Terry High School.
Ownership History
Date
Name
Owned For
Owner Type
Purchase Details
Closed on
Feb 24, 2022
Sold by
Gonzales Jasso Rebecca
Bought by
Salcido Larry
Current Estimated Value
Purchase Details
Closed on
Mar 26, 2019
Sold by
Salcido Larry
Bought by
Jasso Rebecca Gonzales
Purchase Details
Closed on
Jul 25, 2012
Sold by
Gonzales Guadalupe
Bought by
Salicido Larry
Purchase Details
Closed on
Jul 23, 2012
Sold by
Gonzales Guadalupe
Bought by
Salcido Larry
Create a Home Valuation Report for This Property
The Home Valuation Report is an in-depth analysis detailing your home's value as well as a comparison with similar homes in the area
Home Values in the Area
Average Home Value in this Area
Purchase History
| Date | Buyer | Sale Price | Title Company |
|---|---|---|---|
| Salcido Larry | -- | Badger Law Pllc | |
| Jasso Rebecca Gonzales | -- | None Available | |
| Salicido Larry | -- | None Available | |
| Salcido Larry | -- | -- | |
| Salcido Larry | -- | None Available |
Source: Public Records
Tax History
| Year | Tax Paid | Tax Assessment Tax Assessment Total Assessment is a certain percentage of the fair market value that is determined by local assessors to be the total taxable value of land and additions on the property. | Land | Improvement |
|---|---|---|---|---|
| 2025 | $2,050 | $104,336 | $49,680 | $54,656 |
| 2024 | $2,050 | $125,995 | $49,680 | $76,315 |
| 2023 | $1,746 | $90,432 | $13,500 | $76,932 |
| 2022 | $1,136 | $55,460 | $13,500 | $41,960 |
| 2021 | $814 | $39,210 | $13,500 | $25,710 |
| 2020 | $825 | $38,890 | $13,500 | $25,390 |
| 2019 | $718 | $31,450 | $13,500 | $17,950 |
| 2018 | $664 | $28,590 | $4,650 | $23,940 |
| 2017 | $650 | $27,830 | $4,650 | $23,180 |
| 2016 | $650 | $27,860 | $4,650 | $23,210 |
| 2015 | $266 | $28,330 | $4,650 | $23,680 |
| 2014 | $412 | $28,350 | $4,650 | $23,700 |
Source: Public Records
Map
Nearby Homes
Your Personal Tour Guide
Ask me questions while you tour the home.