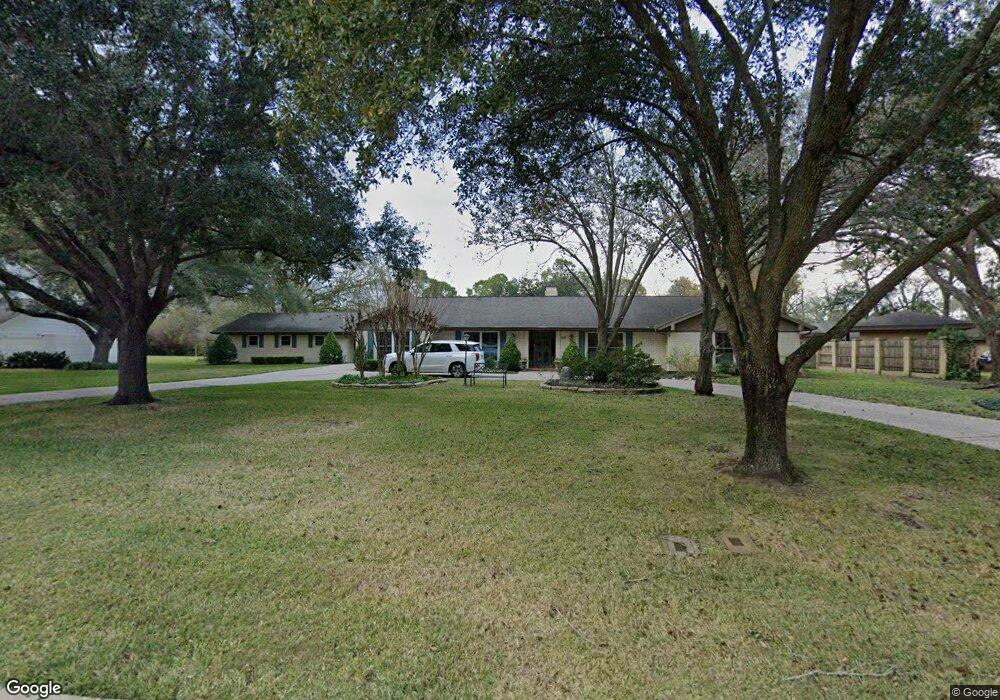
504 Bayou Dr Richmond, TX 77469
Estimated Value: $390,000 - $466,000
4
Beds
3
Baths
3,205
Sq Ft
$133/Sq Ft
Est. Value
About This Home
This home is located at 504 Bayou Dr, Richmond, TX 77469 and is currently estimated at $427,783, approximately $133 per square foot. 504 Bayou Dr is a home located in Fort Bend County with nearby schools including Jane Long Elementary School, J J Wessendorff Middle School, and Lamar Junior High School.
Ownership History
Date
Name
Owned For
Owner Type
Purchase Details
Closed on
Sep 25, 2024
Sold by
Benes Barbara J
Bought by
Benes Michael J and Benes Laura
Current Estimated Value
Purchase Details
Closed on
Mar 20, 2024
Sold by
Benes Joseph B and Benes Barbara
Bought by
Benes Barbara
Purchase Details
Closed on
Mar 15, 2006
Sold by
Barnes J Dwain and Barnes Lynn M
Bought by
Benes Joseph B and Benes Barbara J
Home Financials for this Owner
Home Financials are based on the most recent Mortgage that was taken out on this home.
Original Mortgage
$230,000
Interest Rate
6.19%
Mortgage Type
Fannie Mae Freddie Mac
Purchase Details
Closed on
Dec 20, 1994
Sold by
Hanna E W Family Trust
Bought by
Benes Joseph B and Benes Barbara J
Create a Home Valuation Report for This Property
The Home Valuation Report is an in-depth analysis detailing your home's value as well as a comparison with similar homes in the area
Home Values in the Area
Average Home Value in this Area
Purchase History
| Date | Buyer | Sale Price | Title Company |
|---|---|---|---|
| Benes Michael J | -- | Select Title | |
| Benes Barbara | -- | None Listed On Document | |
| Benes Joseph B | -- | First American Title | |
| Benes Joseph B | -- | -- |
Source: Public Records
Mortgage History
| Date | Status | Borrower | Loan Amount |
|---|---|---|---|
| Previous Owner | Benes Joseph B | $230,000 |
Source: Public Records
Tax History Compared to Growth
Tax History
| Year | Tax Paid | Tax Assessment Tax Assessment Total Assessment is a certain percentage of the fair market value that is determined by local assessors to be the total taxable value of land and additions on the property. | Land | Improvement |
|---|---|---|---|---|
| 2025 | $6,863 | $400,421 | $43,131 | $357,290 |
| 2024 | $6,863 | $381,057 | $43,131 | $337,926 |
| 2023 | $3,599 | $353,540 | $12,069 | $341,471 |
| 2022 | $5,227 | $321,400 | $11,820 | $309,580 |
| 2021 | $6,939 | $292,180 | $43,130 | $249,050 |
| 2020 | $7,163 | $297,190 | $43,130 | $254,060 |
| 2019 | $7,454 | $291,870 | $43,130 | $248,740 |
| 2018 | $7,171 | $279,140 | $43,130 | $236,010 |
| 2017 | $6,757 | $259,980 | $43,130 | $216,850 |
| 2016 | $6,745 | $259,500 | $43,130 | $216,370 |
| 2015 | $4,636 | $235,910 | $43,130 | $192,780 |
| 2014 | $4,567 | $214,460 | $43,130 | $171,330 |
Source: Public Records
Map
Nearby Homes
- 2001 Briar Ln
- 406 Fairway Dr
- 400 Hillcrest Dr
- 0 Meadow Ln
- 7315 Audubon Russet Dr
- 7322 Audubon Russet Dr
- 2143 Alabaster Estate Dr
- 2015 Tanglelane St
- 1004 Country Club Dr
- 805 Chateau Place
- 606 Fannin St
- 505 Austin St
- 1911 Winston Store Loop
- 303 Austin St
- 1810 Winston Store Loop
- 2236 Par Ln
- 512 and 514 Travis St
- 24007 Barnett Overlook
- 2008 Golden Creek Ln
- 515 S 2nd St