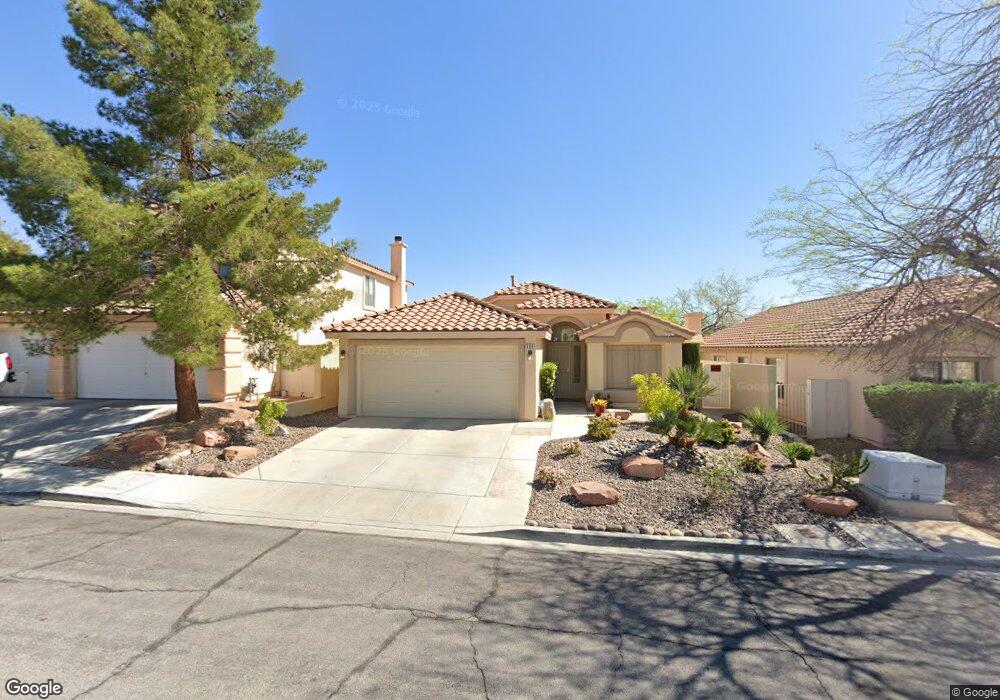
504 Carlton Kay Place Unit 1 Las Vegas, NV 89144
Summerlin NeighborhoodEstimated Value: $467,000 - $546,000
3
Beds
2
Baths
1,446
Sq Ft
$351/Sq Ft
Est. Value
About This Home
This home is located at 504 Carlton Kay Place Unit 1, Las Vegas, NV 89144 and is currently estimated at $507,245, approximately $350 per square foot. 504 Carlton Kay Place Unit 1 is a home located in Clark County with nearby schools including John W. Bonner Elementary School, Sig Rogich Middle School, and Palo Verde High School.
Ownership History
Date
Name
Owned For
Owner Type
Purchase Details
Closed on
Nov 12, 2001
Sold by
Miklosko Connie
Bought by
Miklosko Connie and The Connie Miklosko Revocable Trust
Current Estimated Value
Home Financials for this Owner
Home Financials are based on the most recent Mortgage that was taken out on this home.
Original Mortgage
$123,200
Outstanding Balance
$48,190
Interest Rate
6.88%
Estimated Equity
$459,055
Purchase Details
Closed on
Oct 19, 2001
Sold by
Yang Shin
Bought by
Miklosko Connie
Home Financials for this Owner
Home Financials are based on the most recent Mortgage that was taken out on this home.
Original Mortgage
$123,200
Outstanding Balance
$48,190
Interest Rate
6.88%
Estimated Equity
$459,055
Purchase Details
Closed on
Mar 2, 1998
Sold by
Woodside Homes Of Nevada Inc
Bought by
Yang Shin
Home Financials for this Owner
Home Financials are based on the most recent Mortgage that was taken out on this home.
Original Mortgage
$120,600
Interest Rate
6.99%
Create a Home Valuation Report for This Property
The Home Valuation Report is an in-depth analysis detailing your home's value as well as a comparison with similar homes in the area
Home Values in the Area
Average Home Value in this Area
Purchase History
| Date | Buyer | Sale Price | Title Company |
|---|---|---|---|
| Miklosko Connie | -- | -- | |
| Miklosko Connie | $154,000 | Lawyers Title | |
| Yang Shin | $127,000 | First American Title Co |
Source: Public Records
Mortgage History
| Date | Status | Borrower | Loan Amount |
|---|---|---|---|
| Open | Miklosko Connie | $123,200 | |
| Previous Owner | Yang Shin | $120,600 |
Source: Public Records
Tax History Compared to Growth
Tax History
| Year | Tax Paid | Tax Assessment Tax Assessment Total Assessment is a certain percentage of the fair market value that is determined by local assessors to be the total taxable value of land and additions on the property. | Land | Improvement |
|---|---|---|---|---|
| 2025 | $2,107 | $113,920 | $57,050 | $56,870 |
| 2024 | $2,046 | $113,920 | $57,050 | $56,870 |
| 2023 | $2,046 | $92,803 | $38,850 | $53,953 |
| 2022 | $1,987 | $85,034 | $35,700 | $49,334 |
| 2021 | $1,929 | $82,699 | $35,700 | $46,999 |
| 2020 | $1,870 | $78,223 | $31,500 | $46,723 |
| 2019 | $1,815 | $71,324 | $25,200 | $46,124 |
| 2018 | $1,763 | $66,540 | $22,050 | $44,490 |
| 2017 | $2,179 | $66,284 | $21,350 | $44,934 |
| 2016 | $1,670 | $62,026 | $16,800 | $45,226 |
| 2015 | $1,666 | $60,781 | $16,100 | $44,681 |
| 2014 | $1,617 | $53,846 | $8,750 | $45,096 |
Source: Public Records
Map
Nearby Homes
- 501 Port Hope Place Unit C
- 10353 Niagara Falls Ln
- 10432 American Falls Ln
- 425 Blush Creek Place
- 10452 Niagara Falls Ln
- 525 Crimson View Place
- 523 Crimson View Place
- 229 N Buteo Woods Ln
- 805 Cambridge Cross Place
- 10505 Prime View Ct
- 109 N Buteo Woods Ln
- 602 Painted Cloud Place
- 10504 Narra Place
- 340 Autumn Palace Ct
- 10657 Blue Nile Ct
- 10661 Sapphire Vista Ave
- 10665 Sapphire Vista Ave
- 10665 Blue Nile Ct
- 10680 Sapphire Vista Ave
- 916 Autumn Royal Ln
- 500 Carlton Kay Place
- 508 Carlton Kay Place
- 420 Carlton Kay Place
- 513 Port Hope Place
- 509 Port Hope Place
- 416 Carlton Kay Place
- 505 Port Hope Place
- 505 Carlton Kay Place
- 509 Carlton Kay Place
- 501 Carlton Kay Place
- 421 Carlton Kay Place
- 513 Carlton Kay Place
- 10416 American Falls Ln
- 10420 American Falls Ln
- 10412 American Falls Ln
- 10408 American Falls Ln
- 408 Carlton Kay Place
- 409 Port Hope Place
- 413 Carlton Kay Place
- 10428 American Falls Ln