Estimated Value: $109,294 - $136,000
--
Bed
--
Bath
960
Sq Ft
$127/Sq Ft
Est. Value
About This Home
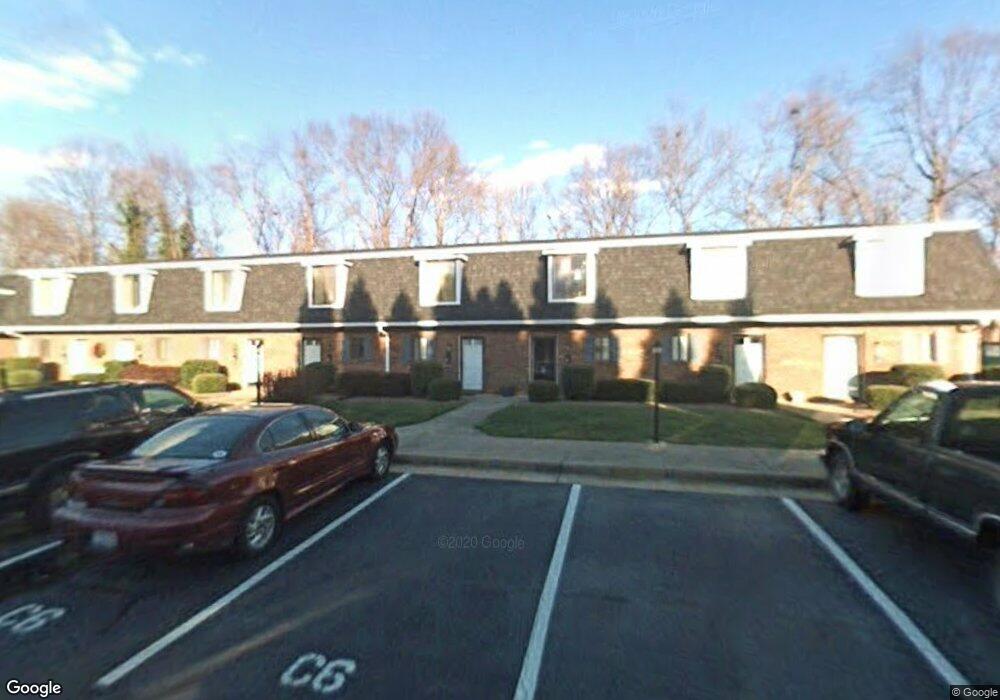
This home is located at 504 Carolyn Ct Unit 7C, Eden, NC 27288 and is currently estimated at $121,824, approximately $126 per square foot. 504 Carolyn Ct Unit 7C is a home located in Rockingham County with nearby schools including Leaksville-Spray Elementary School, J.E. Holmes Middle School, and John M. Morehead High School.
Ownership History
Date
Name
Owned For
Owner Type
Purchase Details
Closed on
Jun 29, 2017
Sold by
Walker Jerry H and Walker Denise H
Bought by
Fulton Logan Rae and Fulton Vencent Eric
Current Estimated Value
Home Financials for this Owner
Home Financials are based on the most recent Mortgage that was taken out on this home.
Original Mortgage
$55,800
Outstanding Balance
$46,525
Interest Rate
4.02%
Mortgage Type
New Conventional
Estimated Equity
$75,299
Purchase Details
Closed on
Oct 23, 2014
Sold by
Pope Stuart T and Pope Teresa L
Bought by
Udo Ekwere
Purchase Details
Closed on
Oct 18, 2010
Sold by
Haunn Mitchell L and Haunn Renae Haunn
Bought by
Pope Stuart T and Pope Teresa L
Home Financials for this Owner
Home Financials are based on the most recent Mortgage that was taken out on this home.
Original Mortgage
$40,000
Interest Rate
3.9%
Mortgage Type
New Conventional
Create a Home Valuation Report for This Property
The Home Valuation Report is an in-depth analysis detailing your home's value as well as a comparison with similar homes in the area
Home Values in the Area
Average Home Value in this Area
Purchase History
| Date | Buyer | Sale Price | Title Company |
|---|---|---|---|
| Fulton Logan Rae | $62,000 | None Available | |
| Udo Ekwere | $59,000 | None Available | |
| Pope Stuart T | $50,500 | Chicago Title Insurance Co |
Source: Public Records
Mortgage History
| Date | Status | Borrower | Loan Amount |
|---|---|---|---|
| Open | Fulton Logan Rae | $55,800 | |
| Previous Owner | Pope Stuart T | $40,000 |
Source: Public Records
Tax History Compared to Growth
Tax History
| Year | Tax Paid | Tax Assessment Tax Assessment Total Assessment is a certain percentage of the fair market value that is determined by local assessors to be the total taxable value of land and additions on the property. | Land | Improvement |
|---|---|---|---|---|
| 2025 | $1,205 | $109,514 | $5,000 | $104,514 |
| 2024 | $1,205 | $109,514 | $5,000 | $104,514 |
| 2023 | $794 | $60,895 | $5,000 | $55,895 |
| 2022 | $794 | $60,895 | $5,000 | $55,895 |
| 2021 | $794 | $60,895 | $5,000 | $55,895 |
| 2020 | $794 | $60,895 | $5,000 | $55,895 |
| 2019 | $794 | $60,895 | $5,000 | $55,895 |
| 2018 | $739 | $56,614 | $12,000 | $44,614 |
| 2017 | $739 | $56,614 | $12,000 | $44,614 |
| 2015 | $746 | $56,614 | $12,000 | $44,614 |
| 2014 | -- | $56,614 | $12,000 | $44,614 |
Source: Public Records
Map
Nearby Homes
- 525 Highland Park Dr Unit F
- 507 Dumaine St
- 634 Highland Dr
- 627 Highland Dr
- 425 Boone Rd
- 522 Glovenia St
- 627 Monroe St
- 561 N Bridge St
- 509 S Van Buren Rd
- 526 N Bridge St
- 521 Walnut St
- 236 N Kennedy Ave
- 543 Patrick St
- 628 Monroe St
- 535 Patrick St
- 401 Greenwood St
- 628 Early Ave
- 521 Patrick St
- 615 S Hamilton St
- 925 Harris St
- 504 Carolyn Ct Unit 8C
- 504 Carolyn Ct Unit 6C
- 504 Carolyn Ct Unit 5C
- 504 Carolyn Ct Unit 4C
- 504 Carolyn Ct Unit 3C
- 504 Carolyn Ct Unit 2C
- 504 Carolyn Ct Unit 1C
- 504 Carolyn Ct Unit C-5
- 504 Carolyn Ct Unit C2
- 504 Carolyn Ct Unit C4
- 504 Carolyn Ct
- 506 Carolyn Ct
- 506 Carolyn Ct Unit 7D
- 506 Carolyn Ct Unit 6D
- 506 Carolyn Ct Unit 5D
- 506 Carolyn Ct Unit 4D
- 506 Carolyn Ct Unit 3D
- 506 Carolyn Ct Unit 2D
- 506 Carolyn Ct Unit 1D
- 506 Carolyn Ct Unit D8