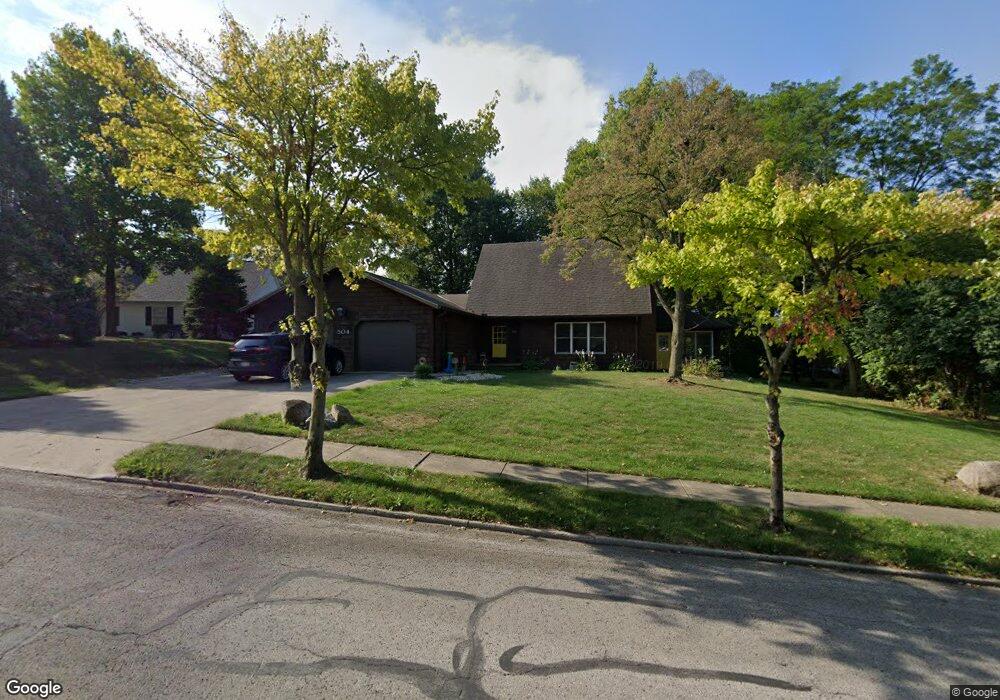
504 Dakota Rd Bellefontaine, OH 43311
Estimated Value: $273,000 - $336,000
3
Beds
2
Baths
2,296
Sq Ft
$130/Sq Ft
Est. Value
About This Home
This home is located at 504 Dakota Rd, Bellefontaine, OH 43311 and is currently estimated at $298,081, approximately $129 per square foot. 504 Dakota Rd is a home located in Logan County with nearby schools including Bellefontaine Elementary School, Bellefontaine Intermediate School, and Bellefontaine Middle School.
Ownership History
Date
Name
Owned For
Owner Type
Purchase Details
Closed on
Feb 12, 2022
Sold by
Burkhardt Lauren E and Burkhardt Michael
Bought by
Burkhardt Michael and Burkhardt Lauren E
Current Estimated Value
Home Financials for this Owner
Home Financials are based on the most recent Mortgage that was taken out on this home.
Original Mortgage
$180,700
Interest Rate
3.55%
Mortgage Type
Balloon
Purchase Details
Closed on
Jun 16, 2016
Sold by
Sheeley Scott Anthony and Sheeley Amy E
Bought by
Burkhardt Lauren E
Home Financials for this Owner
Home Financials are based on the most recent Mortgage that was taken out on this home.
Original Mortgage
$146,400
Interest Rate
3.25%
Mortgage Type
Adjustable Rate Mortgage/ARM
Purchase Details
Closed on
Dec 30, 2008
Bought by
Scott Anthony and Sheeley Amy E
Purchase Details
Closed on
Sep 28, 2000
Bought by
Pool Edgar F
Create a Home Valuation Report for This Property
The Home Valuation Report is an in-depth analysis detailing your home's value as well as a comparison with similar homes in the area
Home Values in the Area
Average Home Value in this Area
Purchase History
| Date | Buyer | Sale Price | Title Company |
|---|---|---|---|
| Burkhardt Michael | -- | Diaz Anselmo & Associates Pa | |
| Burkhardt Lauren E | $183,000 | None Available | |
| Scott Anthony | $145,000 | -- | |
| Sheeley Scott Anthony | -- | -- | |
| Pool Edgar F | $139,900 | -- |
Source: Public Records
Mortgage History
| Date | Status | Borrower | Loan Amount |
|---|---|---|---|
| Previous Owner | Burkhardt Michael | $180,700 | |
| Previous Owner | Burkhardt Lauren E | $146,400 |
Source: Public Records
Tax History Compared to Growth
Tax History
| Year | Tax Paid | Tax Assessment Tax Assessment Total Assessment is a certain percentage of the fair market value that is determined by local assessors to be the total taxable value of land and additions on the property. | Land | Improvement |
|---|---|---|---|---|
| 2024 | $2,810 | $71,370 | $4,620 | $66,750 |
| 2023 | $2,810 | $71,370 | $4,620 | $66,750 |
| 2022 | $3,007 | $54,900 | $3,550 | $51,350 |
| 2021 | $2,440 | $54,900 | $3,550 | $51,350 |
| 2020 | $2,442 | $52,410 | $2,660 | $49,750 |
| 2019 | $2,495 | $52,410 | $2,660 | $49,750 |
| 2018 | $2,011 | $52,410 | $2,660 | $49,750 |
| 2016 | $2,013 | $52,410 | $2,660 | $49,750 |
| 2014 | $2,042 | $52,410 | $2,660 | $49,750 |
| 2013 | $2,040 | $52,410 | $2,660 | $49,750 |
| 2012 | $2,039 | $53,730 | $2,490 | $51,240 |
Source: Public Records
Map
Nearby Homes