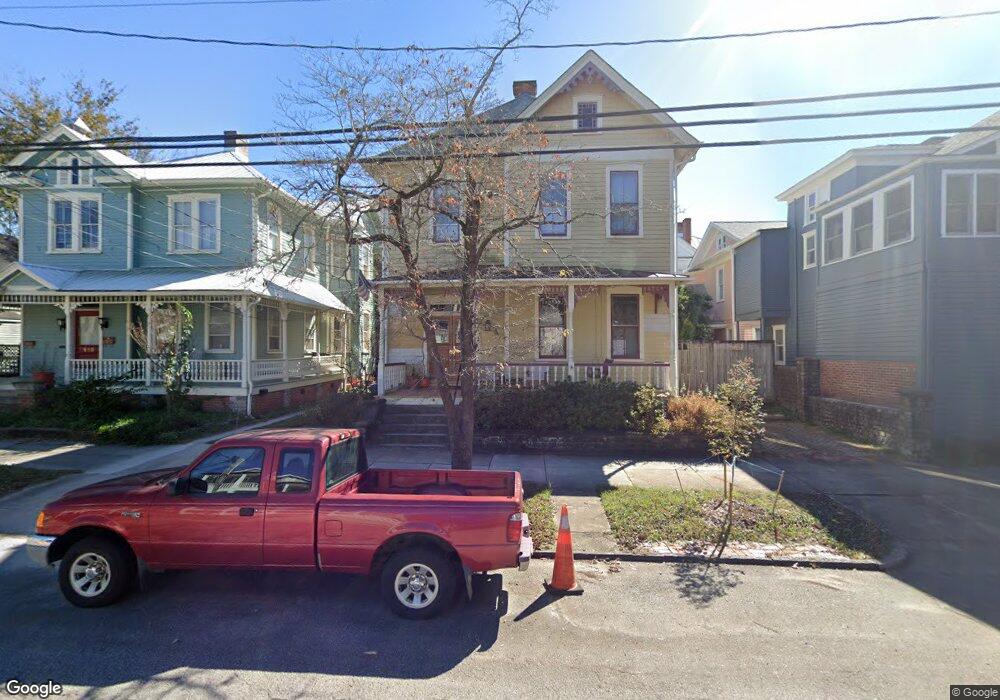
504 Dock St Wilmington, NC 28401
Old Wilmington NeighborhoodEstimated Value: $676,000 - $733,000
3
Beds
2
Baths
2,404
Sq Ft
$295/Sq Ft
Est. Value
About This Home
This home is located at 504 Dock St, Wilmington, NC 28401 and is currently estimated at $709,588, approximately $295 per square foot. 504 Dock St is a home located in New Hanover County with nearby schools including Snipes Academy of Arts & Design, Williston Middle School, and New Hanover High School.
Ownership History
Date
Name
Owned For
Owner Type
Purchase Details
Closed on
Jun 6, 1990
Sold by
Wood David M Susan D
Bought by
Dillard Susan
Current Estimated Value
Purchase Details
Closed on
Jan 1, 1986
Sold by
Corpening Julius H Cynthia
Bought by
Wood David M Susan D
Purchase Details
Closed on
Apr 1, 1979
Bought by
Corpening Julius H Cynthia
Create a Home Valuation Report for This Property
The Home Valuation Report is an in-depth analysis detailing your home's value as well as a comparison with similar homes in the area
Home Values in the Area
Average Home Value in this Area
Purchase History
| Date | Buyer | Sale Price | Title Company |
|---|---|---|---|
| Dillard Susan | -- | -- | |
| Wood David M Susan D | $69,900 | -- | |
| Corpening Julius H Cynthia | $53,400 | -- |
Source: Public Records
Tax History Compared to Growth
Tax History
| Year | Tax Paid | Tax Assessment Tax Assessment Total Assessment is a certain percentage of the fair market value that is determined by local assessors to be the total taxable value of land and additions on the property. | Land | Improvement |
|---|---|---|---|---|
| 2025 | $2,860 | $486,000 | $98,100 | $387,900 |
| 2024 | $3,429 | $394,100 | $74,800 | $319,300 |
| 2023 | $3,330 | $394,100 | $74,800 | $319,300 |
| 2022 | $2,512 | $394,100 | $74,800 | $319,300 |
| 2021 | $3,373 | $394,100 | $74,800 | $319,300 |
| 2020 | $3,159 | $299,900 | $85,300 | $214,600 |
| 2019 | $3,159 | $299,900 | $85,300 | $214,600 |
| 2018 | $3,159 | $299,900 | $85,300 | $214,600 |
| 2017 | $3,159 | $299,900 | $85,300 | $214,600 |
| 2016 | $3,027 | $273,200 | $105,400 | $167,800 |
| 2015 | $2,893 | $273,200 | $105,400 | $167,800 |
| 2014 | $2,770 | $273,200 | $105,400 | $167,800 |
Source: Public Records
Map
Nearby Homes