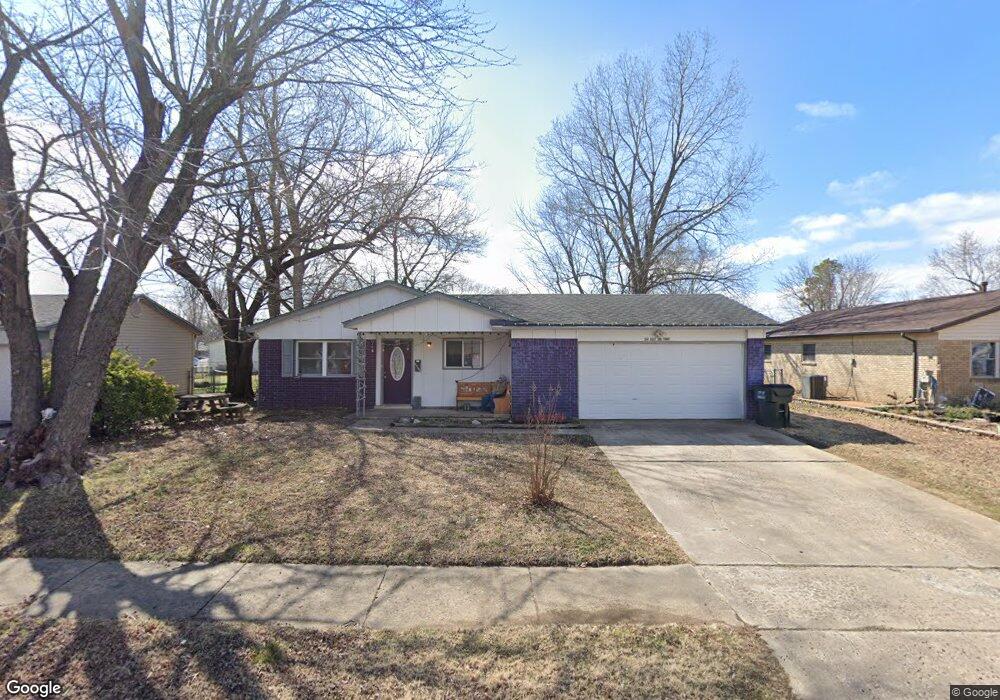
504 E 3rd Ct Owasso, OK 74055
Estimated Value: $157,546 - $199,000
3
Beds
1
Bath
1,049
Sq Ft
$165/Sq Ft
Est. Value
About This Home
This home is located at 504 E 3rd Ct, Owasso, OK 74055 and is currently estimated at $173,137, approximately $165 per square foot. 504 E 3rd Ct is a home located in Tulsa County with nearby schools including Barnes Elementary School, Owasso 6th Grade Center, and Owasso 7th Grade Center.
Ownership History
Date
Name
Owned For
Owner Type
Purchase Details
Closed on
Nov 4, 2009
Sold by
Kirkendall Clinton Joel
Bought by
Shafer Tamera Lynn and Shafer Ramey
Current Estimated Value
Home Financials for this Owner
Home Financials are based on the most recent Mortgage that was taken out on this home.
Original Mortgage
$96,265
Outstanding Balance
$62,186
Interest Rate
5.03%
Mortgage Type
New Conventional
Estimated Equity
$110,951
Purchase Details
Closed on
Dec 18, 2002
Sold by
Hud
Bought by
Hill Maura K
Home Financials for this Owner
Home Financials are based on the most recent Mortgage that was taken out on this home.
Original Mortgage
$62,928
Interest Rate
6.05%
Mortgage Type
Purchase Money Mortgage
Purchase Details
Closed on
Aug 7, 2002
Sold by
Wooten Margaret A
Bought by
Hud
Purchase Details
Closed on
Mar 3, 2000
Sold by
Wooten Harold D
Bought by
Wooten Margaret A
Create a Home Valuation Report for This Property
The Home Valuation Report is an in-depth analysis detailing your home's value as well as a comparison with similar homes in the area
Home Values in the Area
Average Home Value in this Area
Purchase History
| Date | Buyer | Sale Price | Title Company |
|---|---|---|---|
| Shafer Tamera Lynn | $94,500 | Tulsa Abstract & Title Co | |
| Hill Maura K | -- | First Amer Title & Abstract | |
| Hud | -- | Tulsa Abstract & Title Co | |
| Wooten Margaret A | -- | -- |
Source: Public Records
Mortgage History
| Date | Status | Borrower | Loan Amount |
|---|---|---|---|
| Open | Shafer Tamera Lynn | $96,265 | |
| Previous Owner | Hill Maura K | $62,928 |
Source: Public Records
Tax History
| Year | Tax Paid | Tax Assessment Tax Assessment Total Assessment is a certain percentage of the fair market value that is determined by local assessors to be the total taxable value of land and additions on the property. | Land | Improvement |
|---|---|---|---|---|
| 2025 | $1,253 | $11,120 | $1,528 | $9,592 |
| 2024 | $1,134 | $10,767 | $1,649 | $9,118 |
| 2023 | $1,134 | $11,424 | $1,883 | $9,541 |
| 2022 | $1,147 | $10,091 | $2,349 | $7,742 |
| 2021 | $1,135 | $10,091 | $2,349 | $7,742 |
| 2020 | $1,135 | $10,091 | $2,349 | $7,742 |
| 2019 | $1,130 | $10,091 | $2,349 | $7,742 |
| 2018 | $1,095 | $10,091 | $2,349 | $7,742 |
| 2017 | $1,092 | $11,028 | $2,567 | $8,461 |
| 2016 | $1,061 | $10,707 | $2,493 | $8,214 |
| 2015 | $1,034 | $10,395 | $2,420 | $7,975 |
| 2014 | $1,044 | $10,395 | $2,420 | $7,975 |
Source: Public Records
Map
Nearby Homes
- 105 W 5th St
- 601 E 8th St
- 204 W 2nd St
- 802 N Birch St
- 12 N Atlanta St
- 807 N Ash St
- 308 W 3rd St
- 209 W Broadway St
- 213 W Broadway St
- 3189 E 76th St N
- 217 W Broadway St
- 608 N Carlsbad St
- 11829 E 80th Place N
- 104 W 11th St
- 906 N Atlanta St
- 8329 N 118th East Ave
- 213 S Dogwood St
- 8306 N 101st East Ave
- 11713 E 84th Place N
- 8402 N 100th East Ave
Your Personal Tour Guide
Ask me questions while you tour the home.