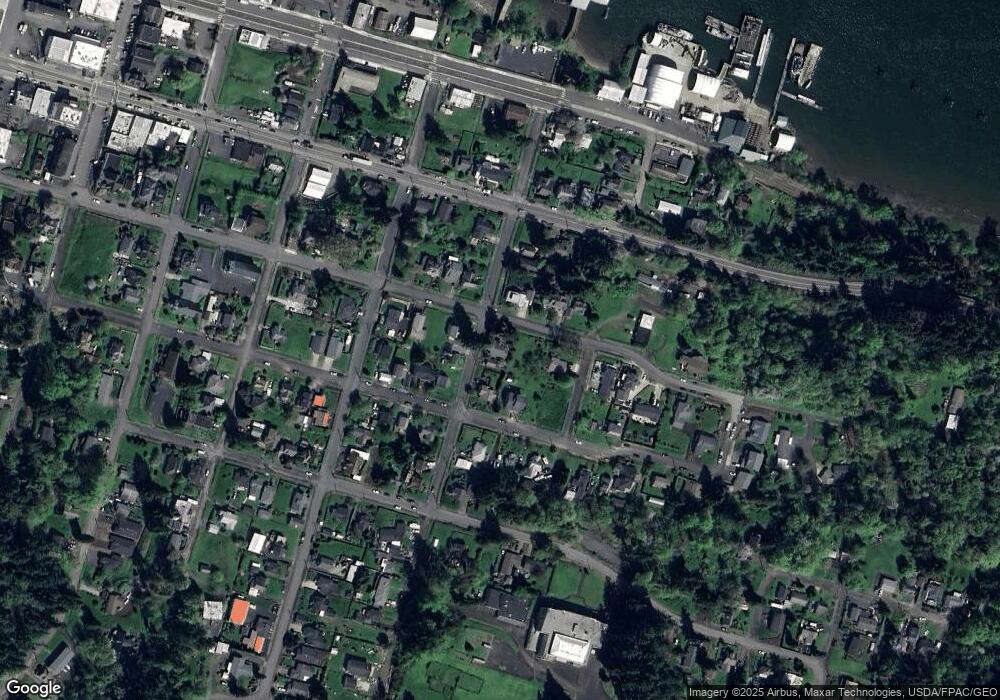
504 E C St Rainier, OR 97048
Estimated Value: $308,000 - $383,000
2
Beds
1
Bath
1,196
Sq Ft
$282/Sq Ft
Est. Value
About This Home
This home is located at 504 E C St, Rainier, OR 97048 and is currently estimated at $337,797, approximately $282 per square foot. 504 E C St is a home located in Columbia County with nearby schools including Hudson Park Elementary School, Rainier Junior/Senior High School, and North Columbia Academy.
Ownership History
Date
Name
Owned For
Owner Type
Purchase Details
Closed on
Dec 14, 2007
Sold by
Garrison Lester B
Bought by
Davis Mary A and Davis Roderick B
Current Estimated Value
Home Financials for this Owner
Home Financials are based on the most recent Mortgage that was taken out on this home.
Original Mortgage
$102,000
Outstanding Balance
$63,841
Interest Rate
6.26%
Mortgage Type
Unknown
Estimated Equity
$273,956
Create a Home Valuation Report for This Property
The Home Valuation Report is an in-depth analysis detailing your home's value as well as a comparison with similar homes in the area
Purchase History
| Date | Buyer | Sale Price | Title Company |
|---|---|---|---|
| Davis Mary A | $142,000 | Ticor Title |
Source: Public Records
Mortgage History
| Date | Status | Borrower | Loan Amount |
|---|---|---|---|
| Open | Davis Mary A | $102,000 |
Source: Public Records
Tax History
| Year | Tax Paid | Tax Assessment Tax Assessment Total Assessment is a certain percentage of the fair market value that is determined by local assessors to be the total taxable value of land and additions on the property. | Land | Improvement |
|---|---|---|---|---|
| 2025 | $2,407 | $130,310 | $35,390 | $94,920 |
| 2024 | $2,351 | $126,520 | $34,360 | $92,160 |
| 2023 | $2,318 | $122,840 | $28,940 | $93,900 |
| 2022 | $2,214 | $119,270 | $27,840 | $91,430 |
| 2021 | $2,178 | $115,800 | $29,630 | $86,170 |
| 2020 | $2,116 | $112,430 | $27,390 | $85,040 |
| 2019 | $2,083 | $109,160 | $27,850 | $81,310 |
| 2018 | $2,035 | $105,990 | $43,680 | $62,310 |
| 2017 | $2,015 | $102,910 | $42,410 | $60,500 |
| 2016 | $1,959 | $99,920 | $41,180 | $58,740 |
| 2015 | $1,597 | $91,040 | $38,490 | $52,550 |
| 2014 | $1,506 | $85,960 | $38,440 | $47,520 |
Source: Public Records
Map
Nearby Homes
Your Personal Tour Guide
Ask me questions while you tour the home.