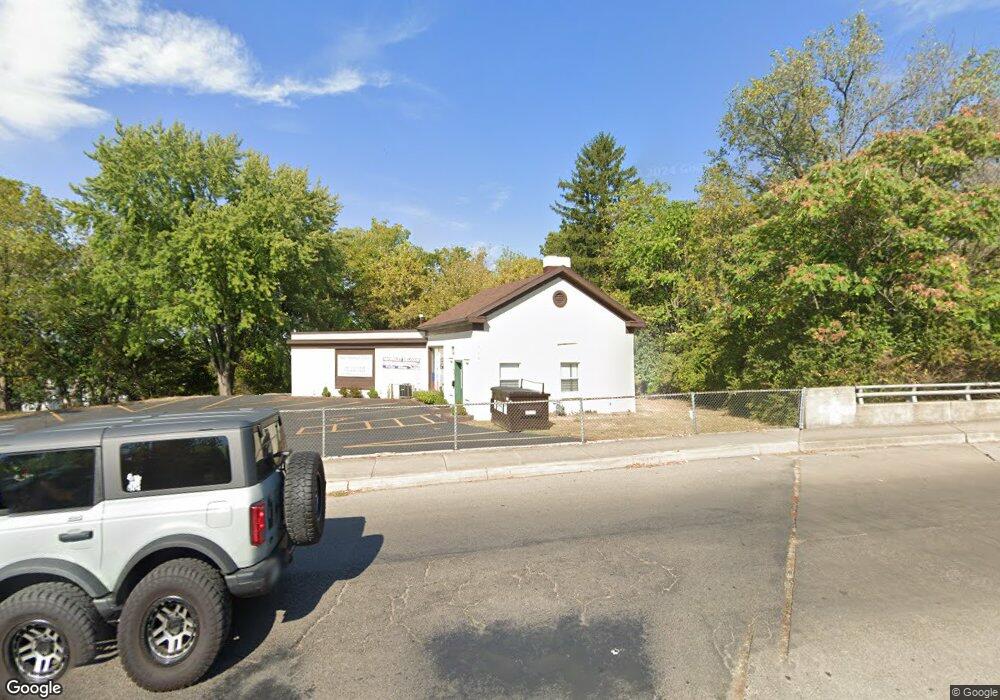
504 E High St Springfield, OH 45505
Estimated Value: $118,555
2
Beds
--
Bath
1,500
Sq Ft
$79/Sq Ft
Est. Value
About This Home
This home is located at 504 E High St, Springfield, OH 45505 and is currently estimated at $118,555, approximately $79 per square foot. 504 E High St is a home located in Clark County with nearby schools including Kenwood Elementary School, Schaefer Middle School, and Springfield High School.
Ownership History
Date
Name
Owned For
Owner Type
Purchase Details
Closed on
Apr 17, 2020
Sold by
Chesnut William Richard and Chesnut Cynthia K
Bought by
Fisher Todd
Current Estimated Value
Home Financials for this Owner
Home Financials are based on the most recent Mortgage that was taken out on this home.
Original Mortgage
$54,000
Outstanding Balance
$47,430
Interest Rate
3.3%
Mortgage Type
Unknown
Estimated Equity
$71,125
Purchase Details
Closed on
May 5, 1992
Sold by
Bennett Jerome P and Bennett William J
Bought by
Chesnut William Richard and Chesnut Cynthia K
Create a Home Valuation Report for This Property
The Home Valuation Report is an in-depth analysis detailing your home's value as well as a comparison with similar homes in the area
Home Values in the Area
Average Home Value in this Area
Purchase History
| Date | Buyer | Sale Price | Title Company |
|---|---|---|---|
| Fisher Todd | $60,000 | City Title Agency | |
| Chesnut William Richard | $47,400 | -- |
Source: Public Records
Mortgage History
| Date | Status | Borrower | Loan Amount |
|---|---|---|---|
| Open | Fisher Todd | $54,000 |
Source: Public Records
Tax History
| Year | Tax Paid | Tax Assessment Tax Assessment Total Assessment is a certain percentage of the fair market value that is determined by local assessors to be the total taxable value of land and additions on the property. | Land | Improvement |
|---|---|---|---|---|
| 2025 | $1,945 | $31,190 | $23,760 | $7,430 |
| 2024 | $1,912 | $26,350 | $21,220 | $5,130 |
| 2023 | $1,912 | $26,350 | $21,220 | $5,130 |
| 2022 | $2,976 | $40,330 | $21,220 | $19,110 |
| 2021 | $1,925 | $26,350 | $21,220 | $5,130 |
| 2020 | $1,924 | $26,350 | $21,220 | $5,130 |
| 2019 | $1,930 | $26,350 | $21,220 | $5,130 |
| 2018 | $2,078 | $28,310 | $21,220 | $7,090 |
| 2017 | $2,091 | $28,312 | $21,217 | $7,095 |
| 2016 | $2,081 | $28,312 | $21,217 | $7,095 |
| 2015 | $2,158 | $28,312 | $21,217 | $7,095 |
| 2014 | $2,082 | $28,312 | $21,217 | $7,095 |
| 2013 | $2,035 | $28,312 | $21,217 | $7,095 |
Source: Public Records
Map
Nearby Homes
- 418 Linden Ave
- 625 Tibbetts Ave
- 411 S Limestone St
- 1065 Mound St Unit 1067
- 718 Summer St
- 705 York St
- 802 Warder St
- 38 W High St Unit 3B
- 1215 E High St
- 453 E Pleasant St
- 1105 Farlow St
- 441 E Euclid Ave
- 1008 Tibbetts Ave
- 360 S Greenmount Ave
- 907-913 S Limestone St
- 321 Glenn Ave
- 315 Glenn Ave
- 114-116 E Ward St
- 412 E Madison Ave
- 726 E Madison Ave
Your Personal Tour Guide
Ask me questions while you tour the home.