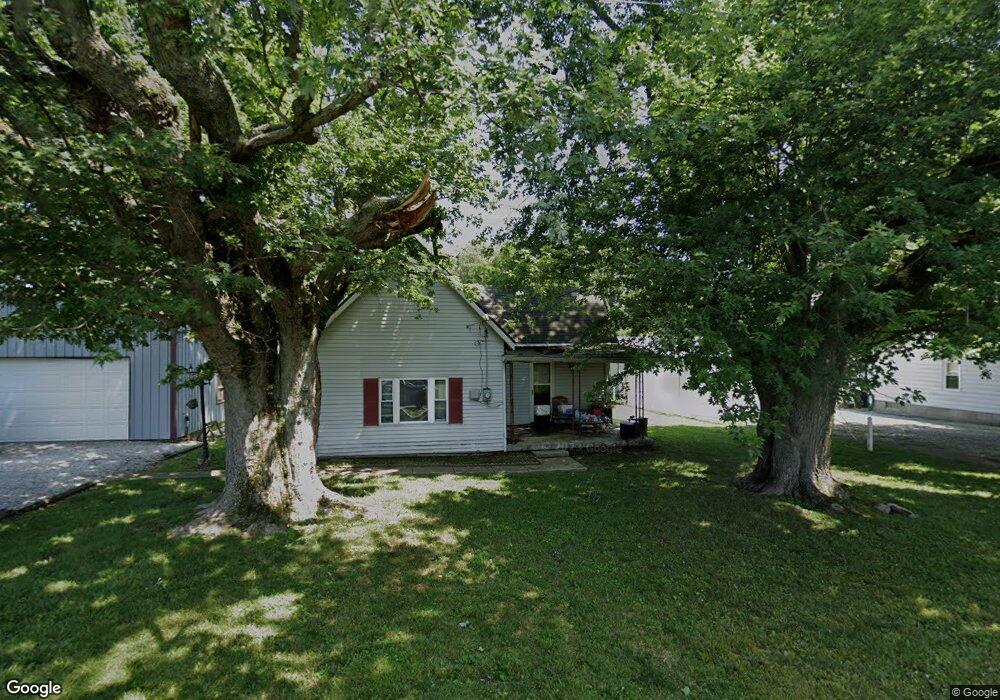
504 E Spring St Bloomfield, IN 47424
Estimated Value: $134,694 - $159,000
2
Beds
1
Bath
932
Sq Ft
$153/Sq Ft
Est. Value
About This Home
This home is located at 504 E Spring St, Bloomfield, IN 47424 and is currently estimated at $142,424, approximately $152 per square foot. 504 E Spring St is a home with nearby schools including Bloomfield Elementary School and Bloomfield Junior/Senior High School.
Ownership History
Date
Name
Owned For
Owner Type
Purchase Details
Closed on
Nov 30, 2018
Sold by
Robinson Donald Wayne and Robinson Neva J
Bought by
Courtney Tammy C
Current Estimated Value
Purchase Details
Closed on
Feb 22, 2008
Sold by
Hsbc Bank Usa
Bought by
Robinson Donald Wayne and Robinson Neva J
Home Financials for this Owner
Home Financials are based on the most recent Mortgage that was taken out on this home.
Original Mortgage
$19,900
Interest Rate
5.51%
Mortgage Type
New Conventional
Purchase Details
Closed on
Oct 30, 2007
Sold by
Covey Richard L
Bought by
Hsbc Bank Usa
Purchase Details
Closed on
Apr 6, 2005
Sold by
Covey Nancy and Covey Richard L
Bought by
Covey Richard L
Create a Home Valuation Report for This Property
The Home Valuation Report is an in-depth analysis detailing your home's value as well as a comparison with similar homes in the area
Purchase History
| Date | Buyer | Sale Price | Title Company |
|---|---|---|---|
| Courtney Tammy C | -- | None Available | |
| Robinson Donald Wayne | -- | None Available | |
| Hsbc Bank Usa | $51,000 | None Available | |
| Covey Richard L | -- | None Available |
Source: Public Records
Mortgage History
| Date | Status | Borrower | Loan Amount |
|---|---|---|---|
| Previous Owner | Robinson Donald Wayne | $19,900 |
Source: Public Records
Tax History
| Year | Tax Paid | Tax Assessment Tax Assessment Total Assessment is a certain percentage of the fair market value that is determined by local assessors to be the total taxable value of land and additions on the property. | Land | Improvement |
|---|---|---|---|---|
| 2025 | $1,509 | $85,800 | $12,400 | $73,400 |
| 2024 | $1,509 | $78,300 | $12,400 | $65,900 |
| 2023 | $3,127 | $67,700 | $12,400 | $55,300 |
| 2022 | $1,313 | $69,400 | $12,400 | $57,000 |
| 2021 | $1,299 | $64,200 | $12,400 | $51,800 |
| 2020 | $1,163 | $60,200 | $12,400 | $47,800 |
| 2019 | $1,018 | $53,200 | $12,400 | $40,800 |
| 2018 | $999 | $51,000 | $12,400 | $38,600 |
| 2017 | $934 | $49,500 | $12,400 | $37,100 |
| 2016 | $960 | $49,300 | $12,400 | $36,900 |
| 2014 | $781 | $46,600 | $12,400 | $34,200 |
| 2013 | -- | $46,300 | $12,400 | $33,900 |
Source: Public Records
Map
Nearby Homes
- 633 S Washington St
- 1997 N Cold Springs Rd
- 0 Cleveland St
- Lot 4 E Cedar Ridge Ln
- 332 N Cavins St
- 6 E Judson St
- 318, 332 W Spring St
- 551 N Washington St
- 430 W Spring St
- 209 River Dr
- 207 River Dr
- 422 W Turner St
- 530 W Spring St
- 523 W South St
- 466 David Dr
- 1208 S 1st St
- 600 Forest Dr
- 2082 Indiana 54
- 1201 Indiana 157
- 3354 E Ore Branch Rd
Your Personal Tour Guide
Ask me questions while you tour the home.