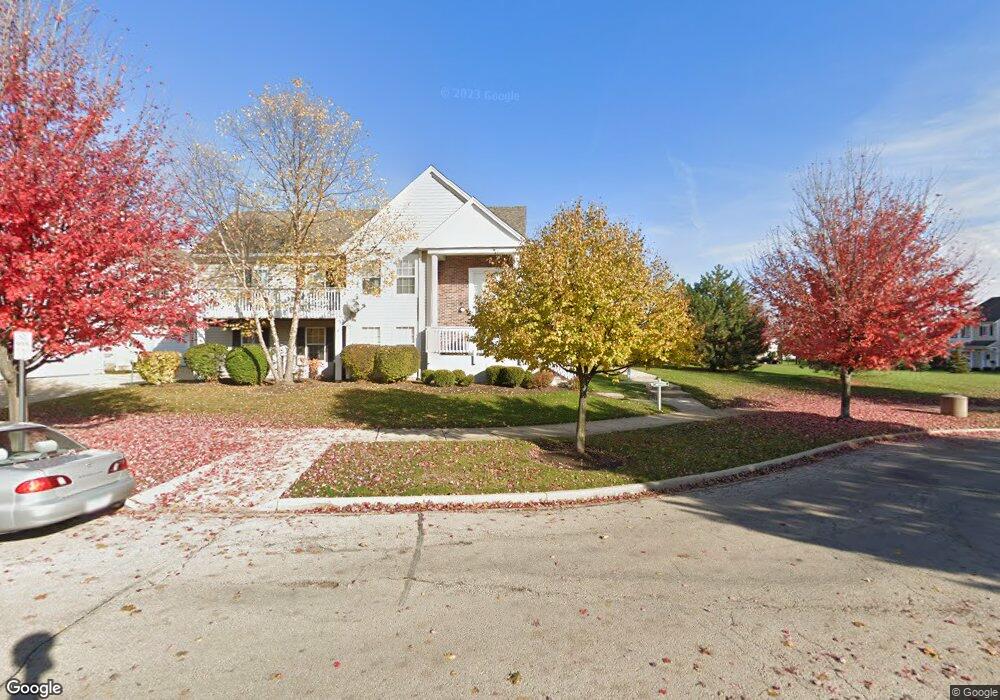
504 Hidden Creek Ln Unit 3702 North Aurora, IL 60542
Estimated Value: $233,000 - $249,000
3
Beds
3
Baths
1,008
Sq Ft
$237/Sq Ft
Est. Value
About This Home
This home is located at 504 Hidden Creek Ln Unit 3702, North Aurora, IL 60542 and is currently estimated at $238,556, approximately $236 per square foot. 504 Hidden Creek Ln Unit 3702 is a home located in Kane County with nearby schools including Goodwin Elementary School, Jewel Middle School, and West Aurora High School.
Ownership History
Date
Name
Owned For
Owner Type
Purchase Details
Closed on
Sep 26, 2003
Sold by
Valdez Jose and Jimenez Donna
Bought by
Mescher George R and Mescher Arlene
Current Estimated Value
Purchase Details
Closed on
Oct 16, 2001
Sold by
Rangel Gilbert and Rangel Jill
Bought by
Elkins Donna J and Jimenez Valdez Jose
Home Financials for this Owner
Home Financials are based on the most recent Mortgage that was taken out on this home.
Original Mortgage
$122,846
Interest Rate
6.8%
Mortgage Type
FHA
Purchase Details
Closed on
Aug 21, 1996
Sold by
The Bigelow Group Inc
Bought by
Rangel Gilbert and Rangel Jill
Home Financials for this Owner
Home Financials are based on the most recent Mortgage that was taken out on this home.
Original Mortgage
$97,150
Interest Rate
8.47%
Mortgage Type
FHA
Create a Home Valuation Report for This Property
The Home Valuation Report is an in-depth analysis detailing your home's value as well as a comparison with similar homes in the area
Home Values in the Area
Average Home Value in this Area
Purchase History
| Date | Buyer | Sale Price | Title Company |
|---|---|---|---|
| Mescher George R | $136,000 | -- | |
| Elkins Donna J | $126,500 | -- | |
| Rangel Gilbert | $100,000 | Century Title Co |
Source: Public Records
Mortgage History
| Date | Status | Borrower | Loan Amount |
|---|---|---|---|
| Previous Owner | Elkins Donna J | $122,846 | |
| Previous Owner | Rangel Gilbert | $97,150 |
Source: Public Records
Tax History Compared to Growth
Tax History
| Year | Tax Paid | Tax Assessment Tax Assessment Total Assessment is a certain percentage of the fair market value that is determined by local assessors to be the total taxable value of land and additions on the property. | Land | Improvement |
|---|---|---|---|---|
| 2024 | $3,088 | $56,568 | $7,184 | $49,384 |
| 2023 | $2,023 | $50,543 | $6,419 | $44,124 |
| 2022 | $2,475 | $46,116 | $5,857 | $40,259 |
| 2021 | $2,551 | $42,935 | $5,453 | $37,482 |
| 2020 | $2,599 | $48,309 | $5,065 | $43,244 |
| 2019 | $2,733 | $44,760 | $4,693 | $40,067 |
| 2018 | $2,827 | $43,345 | $4,341 | $39,004 |
| 2017 | $2,909 | $40,540 | $5,166 | $35,374 |
| 2016 | $2,818 | $38,749 | $4,428 | $34,321 |
| 2015 | -- | $33,627 | $3,808 | $29,819 |
| 2014 | -- | $31,819 | $3,140 | $28,679 |
| 2013 | -- | $31,366 | $3,095 | $28,271 |
Source: Public Records
Map
Nearby Homes
- 1202 Fox Hill Ln Unit 362
- 311 Hidden Creek Ln Unit 311
- 316 E Victoria Cir Unit 125
- 420 Hidden Creek Ln Unit 65
- 201 Hidden Creek Ln Unit 301
- 203 E Victoria Cir Unit 9/2
- 109 E Victoria Cir Unit 7/5
- 1403 Prairie Ct
- 71 Windstone Dr
- 1640 Abington Ln
- 413 Messenger Cir
- Lot 16 West Orchard Gateway Blvd
- 43 S Juniper Dr Unit 3
- 1432 Hartsburg Ln Unit 1
- 13 Poplar Place
- Lot 1 North Orchard Gateway Blvd
- Lot 16 Orchard Gateway Blvd
- 438 Mallard Point Dr
- 406 Juniper Dr
- Lot 13 Towne Center Dr
- 508 Hidden Creek Ln Unit 3704
- 510 Hidden Creek Ln Unit 37/05
- 506 Hidden Creek Ln Unit 37/03
- 512 Hidden Creek Ln Unit 376
- 601 Hidden Creek Ln Unit 38/01
- 609 Hidden Creek Ln Unit 38/5
- 605 Hidden Creek Ln Unit 383
- 607 Hidden Creek Ln Unit 384
- 611 Hidden Creek Ln Unit 38/6
- 603 Hidden Creek Ln Unit 382
- 605 Hidden Creek Ln Unit 605
- 1204 Fox Hill Ln Unit 36/3
- 1206 Fox Hill Ln Unit 364
- 602 Hidden Creek Ln Unit 39I
- 604 Hidden Creek Ln Unit 1
- 608 Hidden Creek Ln Unit 394
- 606 Hidden Creek Ln Unit 393
- 612 Hidden Creek Ln Unit 39/6
- 610 Hidden Creek Ln Unit 395
- 515 Hidden Creek Ln Unit 15/7