504 Juniper Ave Glendive, MT 59330
Estimated Value: $166,000 - $287,117
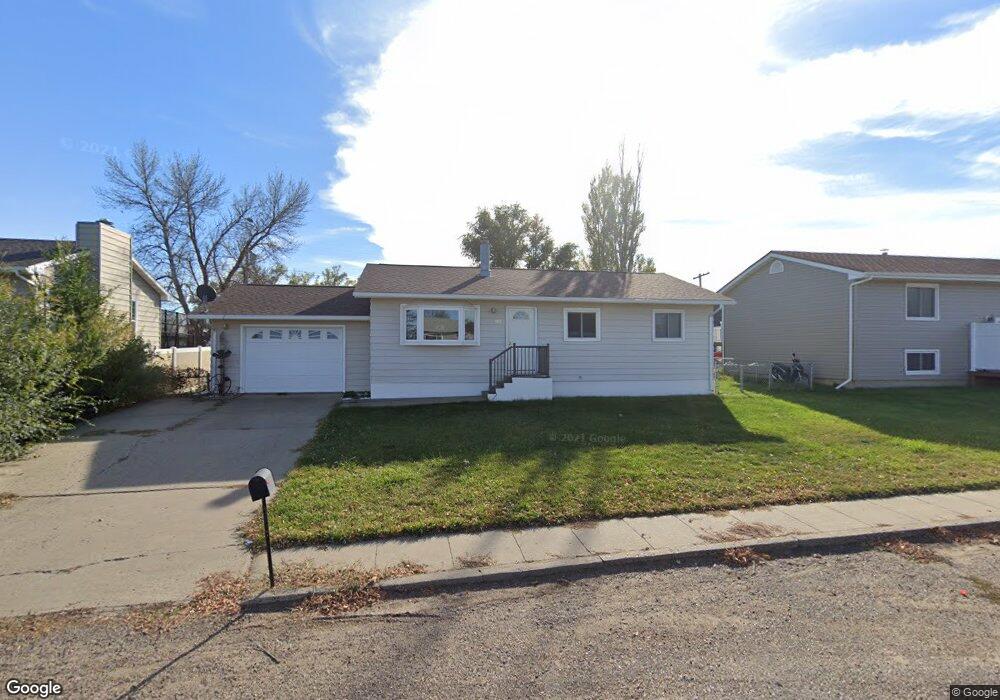
About This Home
This home is located at 504 Juniper Ave, Glendive, MT 59330 and is currently estimated at $234,279, approximately $220 per square foot. 504 Juniper Ave is a home located in Dawson County with nearby schools including Dawson High School and Valley View Seventh-day Adventist School.
Ownership History
We collect this data history from publicly available records. To have your information removed, we recommend requesting removal directly through your county’s website.
Purchase Details
Home Financials for this Owner
Home Financials are based on the most recent Mortgage that was taken out on this home.Purchase Details
Home Values in the Area
Average Home Value in this Area
Purchase History
We collect this data history from publicly available records. To have your information removed, we recommend requesting removal directly through your county’s website.
| Date | Buyer | Sale Price | Title Company |
|---|---|---|---|
| $214,000 | First American Title | ||
| -- | -- |
Mortgage History
We collect this data history from publicly available records. To have your information removed, we recommend requesting removal directly through your county’s website.
| Date | Status | Borrower | Loan Amount |
|---|---|---|---|
| Open | $171,200 |
Tax History
We collect this data history from publicly available records. To have your information removed, we recommend requesting removal directly through your county’s website.
| Year | Tax Paid | Tax Assessment Tax Assessment Total Assessment is a certain percentage of the fair market value that is determined by local assessors to be the total taxable value of land and additions on the property. | Land | Improvement |
|---|---|---|---|---|
| 2025 | $3,366 | $222,700 | $0 | $0 |
| 2024 | $3,772 | $169,800 | $0 | $0 |
| 2023 | $3,643 | $169,800 | $0 | $0 |
| 2022 | $2,044 | $155,900 | $0 | $0 |
| 2021 | $281 | $155,900 | $0 | $0 |
| 2020 | $2,605 | $173,400 | $0 | $0 |
| 2019 | $2,632 | $173,400 | $0 | $0 |
| 2018 | $3,226 | $192,300 | $0 | $0 |
| 2017 | $3,158 | $192,300 | $0 | $0 |
| 2016 | $3,490 | $210,800 | $0 | $0 |
| 2015 | $2,052 | $210,800 | $0 | $0 |
| 2014 | $1,193 | $69,059 | $0 | $0 |
Map
- 217 Chestnut Ave
- 799 S Gallatin St
- 33 Montana 16 Unit 272
- 713 and 711 N Oneil Ave
- 121 3rd Cottonwood Grove
- 113 3rd Cottonwood Grove
- 108 S Douglas St
- 406 Country Club Rd
- 313 N River Ave
- 212 W Benham St
- 509 Snyder Ave
- 411 E Mann St
- 512 E Barry St
- 513 E Barry St
- 151 Seven Mile Dr
- 117 S Sargent Ave
- 811 N Meade Ave
- 307 N Sargent Ave
- 311 N Sargent Ave
- 419 & 415 Rosser
Ask me questions while you tour the home.