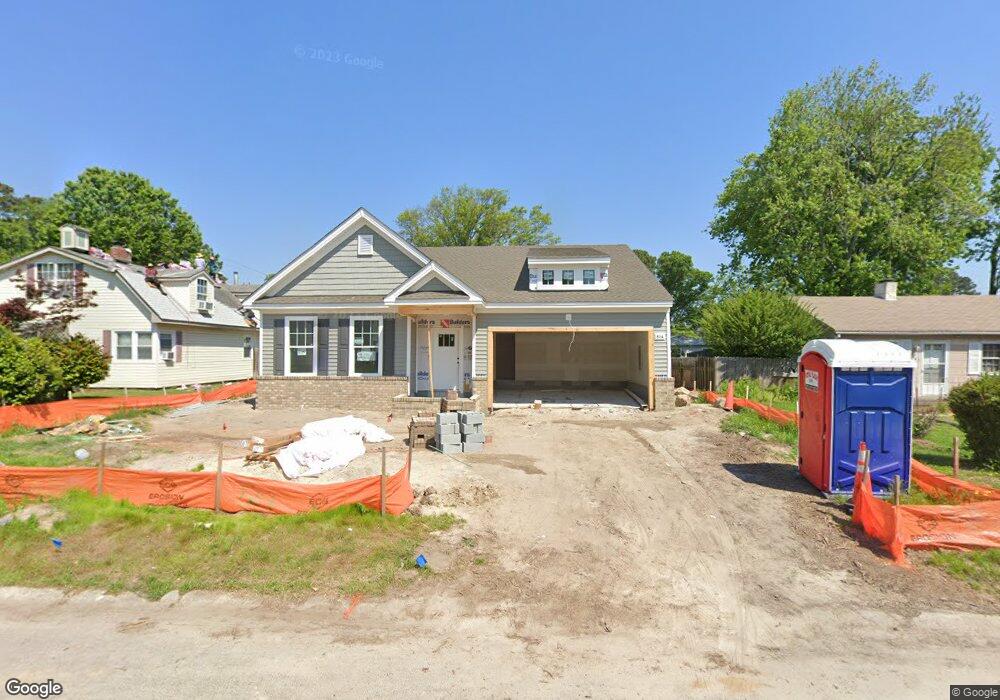
504 Marchant Rd Norfolk, VA 23505
Oakdale Farms NeighborhoodEstimated Value: $418,000 - $453,000
4
Beds
2
Baths
2,100
Sq Ft
$207/Sq Ft
Est. Value
About This Home
This home is located at 504 Marchant Rd, Norfolk, VA 23505 and is currently estimated at $434,684, approximately $206 per square foot. 504 Marchant Rd is a home located in Norfolk City with nearby schools including Crossroads School, Norview Middle School, and Granby High School.
Ownership History
Date
Name
Owned For
Owner Type
Purchase Details
Closed on
Jun 29, 2023
Sold by
Wh Chesapeake Llc
Bought by
Collins Todd Aaron and Collins Alicen Burton
Current Estimated Value
Home Financials for this Owner
Home Financials are based on the most recent Mortgage that was taken out on this home.
Original Mortgage
$234,900
Outstanding Balance
$228,868
Interest Rate
6.39%
Mortgage Type
VA
Estimated Equity
$205,816
Purchase Details
Closed on
Aug 29, 2022
Sold by
Us Properties Services Llc
Bought by
Wh Chesapeake Llc
Purchase Details
Closed on
Aug 22, 2022
Sold by
Julius Army Michael
Bought by
Us Properties Services Llc
Purchase Details
Closed on
Oct 6, 2014
Sold by
Gould Patricia Anne and Army Michael J
Bought by
Gould Patricia Anne
Purchase Details
Closed on
Jun 18, 2008
Sold by
Gould Patricia Anne
Bought by
Gould Patricia Anne and Army Michael J
Home Financials for this Owner
Home Financials are based on the most recent Mortgage that was taken out on this home.
Original Mortgage
$107,590
Interest Rate
6.69%
Mortgage Type
FHA
Create a Home Valuation Report for This Property
The Home Valuation Report is an in-depth analysis detailing your home's value as well as a comparison with similar homes in the area
Home Values in the Area
Average Home Value in this Area
Purchase History
| Date | Buyer | Sale Price | Title Company |
|---|---|---|---|
| Collins Todd Aaron | $409,900 | Fidelity National Title | |
| Wh Chesapeake Llc | $110,000 | Fidelity National Title | |
| Us Properties Services Llc | $94,891 | Fidelity National Title | |
| Gould Patricia Anne | -- | None Available | |
| Gould Patricia Anne | -- | First American Title |
Source: Public Records
Mortgage History
| Date | Status | Borrower | Loan Amount |
|---|---|---|---|
| Open | Collins Todd Aaron | $234,900 | |
| Previous Owner | Gould Patricia Anne | $107,590 |
Source: Public Records
Tax History Compared to Growth
Tax History
| Year | Tax Paid | Tax Assessment Tax Assessment Total Assessment is a certain percentage of the fair market value that is determined by local assessors to be the total taxable value of land and additions on the property. | Land | Improvement |
|---|---|---|---|---|
| 2025 | $4,940 | $395,200 | $81,500 | $313,700 |
| 2024 | $4,706 | $382,600 | $81,500 | $301,100 |
| 2023 | $4,248 | $339,800 | $81,500 | $258,300 |
| 2022 | $1,746 | $139,700 | $60,500 | $79,200 |
| 2021 | $1,603 | $128,200 | $55,000 | $73,200 |
| 2020 | $1,540 | $123,200 | $50,000 | $73,200 |
| 2019 | $0 | $123,200 | $50,000 | $73,200 |
| 2018 | $1,373 | $119,400 | $50,000 | $69,400 |
| 2017 | $1,352 | $117,600 | $50,000 | $67,600 |
| 2016 | $1,321 | $114,600 | $50,000 | $64,600 |
| 2015 | $1,309 | $114,600 | $50,000 | $64,600 |
| 2014 | $1,309 | $114,600 | $50,000 | $64,600 |
Source: Public Records
Map
Nearby Homes
- 549 Burksdale Rd
- 557 Burksdale Rd
- 8214 Simons Dr
- 525 Dixie Dr
- 7909 Simons Dr
- 7920 E Glen Rd
- 617 Palmer Turn
- 414 E Little Creek Rd
- 551 Ashlawn Dr
- 8123 Kenwood Dr
- 8248 Andrew Ln
- 8249 Gygax Rd
- 319 Ashlawn Dr
- 741 Bancker Rd
- 538 Draper Dr
- 357 Fort Worth Ave Unit 107
- 357 Fort Worth Ave Unit 110
- 744 Sheppard Ave
- 8010 W Glen Rd
- 8034 Old Ocean View Rd
- 502 Marchant Rd
- 508 Marchant Rd
- 500 Marchant Rd
- 512 Marchant Rd
- 505 Burksdale Rd
- 501 Burksdale Rd
- 509 Burksdale Rd
- 8108 Simons Dr
- 501 Mcfarland Rd
- 513 Burksdale Rd
- 516 Marchant Rd
- 8117 Simons Dr
- 505 Mcfarland Rd
- 8113 Simons Dr
- 8104 Simons Dr
- 517 Burksdale Rd
- 520 Marchant Rd
- 8109 Simons Dr
- 8121 Simons Dr
- 8200 Simons Dr