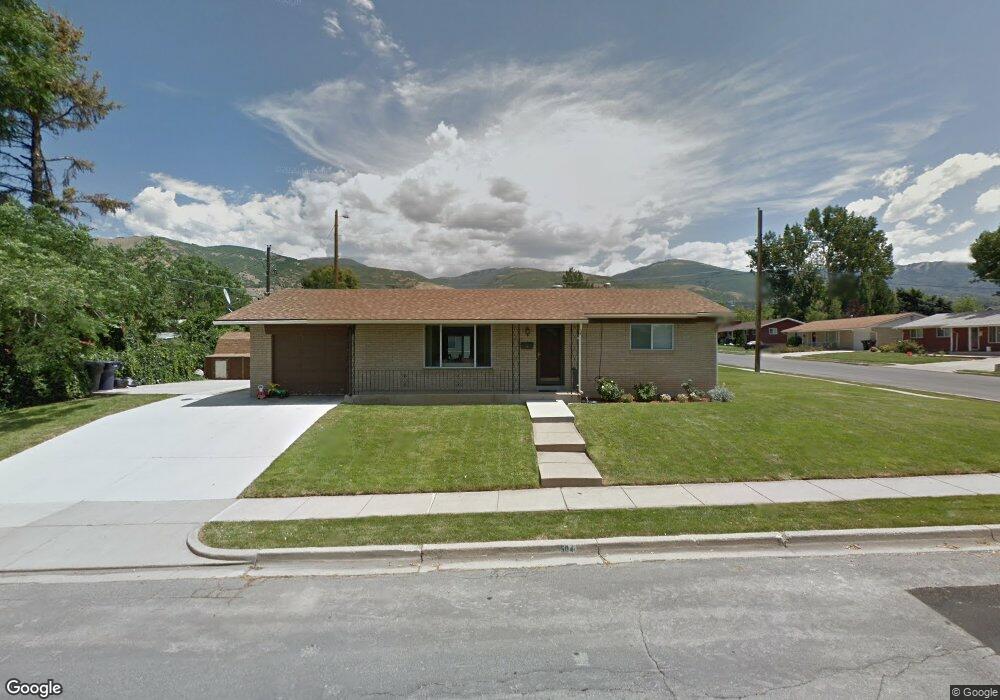
504 N 200 E Bountiful, UT 84010
Estimated Value: $484,000 - $582,000
4
Beds
2
Baths
2,174
Sq Ft
$237/Sq Ft
Est. Value
About This Home
This home is located at 504 N 200 E, Bountiful, UT 84010 and is currently estimated at $514,824, approximately $236 per square foot. 504 N 200 E is a home located in Davis County with nearby schools including Tolman School, Bountiful Junior High School, and Viewmont High School.
Ownership History
Date
Name
Owned For
Owner Type
Purchase Details
Closed on
Dec 9, 2016
Sold by
Farley Delbert and Daugherty Melodi
Bought by
Tulip Tree Apartments Llc
Current Estimated Value
Purchase Details
Closed on
May 23, 2012
Sold by
Woodruff Lonnie R
Bought by
Farley Delbert G and Farley Melodi J
Home Financials for this Owner
Home Financials are based on the most recent Mortgage that was taken out on this home.
Original Mortgage
$135,920
Interest Rate
3.84%
Mortgage Type
New Conventional
Purchase Details
Closed on
Jun 23, 2009
Sold by
Woodruff Trissa L
Bought by
Woodruff Lonnie R
Purchase Details
Closed on
Jan 29, 1996
Sold by
Roberts Michael K and Roberts Molly A
Bought by
Woodruff Lonnie R and Woodruff Trissa L
Home Financials for this Owner
Home Financials are based on the most recent Mortgage that was taken out on this home.
Original Mortgage
$114,300
Interest Rate
7.25%
Create a Home Valuation Report for This Property
The Home Valuation Report is an in-depth analysis detailing your home's value as well as a comparison with similar homes in the area
Purchase History
| Date | Buyer | Sale Price | Title Company |
|---|---|---|---|
| Tulip Tree Apartments Llc | -- | Northwest Title | |
| Farley Delbert G | -- | Inwest Title Services | |
| Woodruff Lonnie R | -- | First American Title | |
| Woodruff Lonnie R | -- | Western States Title Company |
Source: Public Records
Mortgage History
| Date | Status | Borrower | Loan Amount |
|---|---|---|---|
| Previous Owner | Farley Delbert G | $135,920 | |
| Previous Owner | Woodruff Lonnie R | $114,300 |
Source: Public Records
Tax History
| Year | Tax Paid | Tax Assessment Tax Assessment Total Assessment is a certain percentage of the fair market value that is determined by local assessors to be the total taxable value of land and additions on the property. | Land | Improvement |
|---|---|---|---|---|
| 2025 | $2,791 | $254,650 | $116,075 | $138,575 |
| 2024 | $2,600 | $246,399 | $101,006 | $145,393 |
| 2023 | $2,491 | $235,400 | $103,606 | $131,793 |
| 2022 | $2,439 | $417,000 | $188,281 | $228,719 |
| 2021 | $2,247 | $323,000 | $135,415 | $187,585 |
| 2020 | $1,991 | $287,000 | $116,517 | $170,483 |
| 2019 | $2,022 | $285,000 | $128,940 | $156,060 |
| 2018 | $1,856 | $257,000 | $126,992 | $130,008 |
| 2016 | $1,461 | $108,680 | $51,192 | $57,488 |
| 2015 | $1,417 | $99,385 | $51,192 | $48,193 |
| 2014 | $1,411 | $102,004 | $51,192 | $50,812 |
| 2013 | -- | $90,661 | $39,786 | $50,875 |
Source: Public Records
Map
Nearby Homes
- 453 N 400 E Unit 7-D
- 17 E 400 N Unit 19B
- 513 N 400 E Unit 14B
- 49 E 200 N Unit 4
- 41 E 200 N Unit 6
- 978 N 170 E
- 252 N Main St
- 256 N Main St
- 254 N Main St
- 55 E 200 N Unit 2
- 51 E 200 N Unit 3
- 214 E 1250 N
- 320 N 200 W Unit 4
- 499 N 200 W Unit 30
- 499 N 200 W Unit 19
- 563 N 200 W
- 332 N 300 W
- 683 E 100 N
- 1420 N Main St
- 1130 N 200 W
Your Personal Tour Guide
Ask me questions while you tour the home.