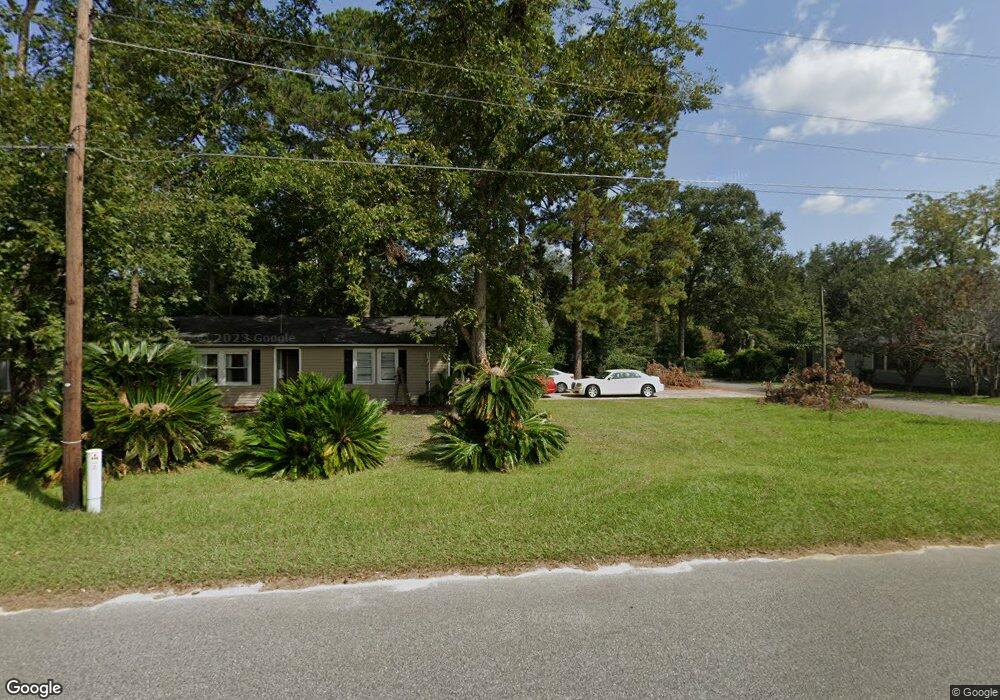
504 N Crawford St Waycross, GA 31503
Estimated Value: $97,000 - $154,000
3
Beds
2
Baths
2,752
Sq Ft
$47/Sq Ft
Est. Value
About This Home
This home is located at 504 N Crawford St, Waycross, GA 31503 and is currently estimated at $128,290, approximately $46 per square foot. 504 N Crawford St is a home located in Ware County with nearby schools including Waresboro Elementary School, Ware County Middle School, and Ware County High School.
Ownership History
Date
Name
Owned For
Owner Type
Purchase Details
Closed on
May 18, 2020
Sold by
Nolan Debra Ann
Bought by
Smith Fallon Sachone
Current Estimated Value
Home Financials for this Owner
Home Financials are based on the most recent Mortgage that was taken out on this home.
Original Mortgage
$75,656
Outstanding Balance
$67,042
Interest Rate
3.3%
Mortgage Type
New Conventional
Estimated Equity
$61,248
Purchase Details
Closed on
Jun 27, 2008
Sold by
Nationstar Mortgage Llc
Bought by
Nolan Debra Ann
Purchase Details
Closed on
Jun 24, 2003
Sold by
Standard Federal Bank
Bought by
Taylor Kalista L
Purchase Details
Closed on
Mar 4, 2003
Sold by
Johnson Roderick
Bought by
Standard Federal Bank
Purchase Details
Closed on
Nov 20, 2000
Sold by
Griffin Dessie M
Bought by
Johnson Roderick
Purchase Details
Closed on
Dec 31, 1997
Sold by
Griffin Dessie M
Bought by
Griffin Dessie M
Create a Home Valuation Report for This Property
The Home Valuation Report is an in-depth analysis detailing your home's value as well as a comparison with similar homes in the area
Home Values in the Area
Average Home Value in this Area
Purchase History
| Date | Buyer | Sale Price | Title Company |
|---|---|---|---|
| Smith Fallon Sachone | $74,900 | -- | |
| Nolan Debra Ann | $35,500 | -- | |
| Taylor Kalista L | $47,500 | -- | |
| Standard Federal Bank | $68,500 | -- | |
| Johnson Roderick | $66,000 | -- | |
| Griffin Dessie M | -- | -- |
Source: Public Records
Mortgage History
| Date | Status | Borrower | Loan Amount |
|---|---|---|---|
| Open | Smith Fallon Sachone | $75,656 |
Source: Public Records
Tax History Compared to Growth
Tax History
| Year | Tax Paid | Tax Assessment Tax Assessment Total Assessment is a certain percentage of the fair market value that is determined by local assessors to be the total taxable value of land and additions on the property. | Land | Improvement |
|---|---|---|---|---|
| 2024 | $153 | $34,042 | $2,516 | $31,526 |
| 2023 | $813 | $29,200 | $1,777 | $27,423 |
| 2022 | $940 | $29,553 | $1,777 | $27,776 |
| 2021 | $1,013 | $23,433 | $1,777 | $21,656 |
| 2020 | $944 | $23,111 | $1,777 | $21,334 |
| 2019 | $779 | $19,076 | $1,777 | $17,299 |
| 2018 | $750 | $18,269 | $1,777 | $16,492 |
| 2017 | $731 | $18,269 | $1,777 | $16,492 |
| 2016 | $731 | $18,269 | $1,777 | $16,492 |
| 2015 | $736 | $18,269 | $1,777 | $16,492 |
| 2014 | $736 | $18,269 | $1,777 | $16,492 |
| 2013 | -- | $19,383 | $1,777 | $17,606 |
Source: Public Records
Map
Nearby Homes
- 1401 Carswell Ave
- 00 Roosevelt St
- 0 Camp Branch Cross Rd Unit 12958956
- 0 Camp Branch Cross Rd Unit 147575
- 0 Camp Branch Cross Rd Unit 10127958
- 1322 Jane St
- 605 Walker St
- 6905 Kendal Ct
- 0 S Georgia Pkwy W
- 1208 Margaret St
- 1003 Carswell Ave
- 505 N Nicholls St
- 503 N Nicholls St
- 601 N Nicholls St
- 1006 Roosevelt St
- 1103 Ann St
- 1125 Georgia St
- 506 McDonald St
- 803 Elizabeth St
- 516 Folks St
- 1224 Pine St
- 506 N Crawford St
- 500 N Crawford St
- 508 N Crawford St
- 501 N Crawford St
- 1214 Isabella St
- 1323 Carswell Ave
- 1321 Carswell Ave
- 503 N Crawford St
- 1315 Carswell Ave
- 1318 Pine St
- 1313 Carswell Ave
- 1212 Isabella St
- 408 N Crawford St
- 1208 Pine St
- 1320 Pine St
- 415 S Crawford St
- 1309 Carswell Ave
- 1411 Carswell Ave
- 1322 Pine St