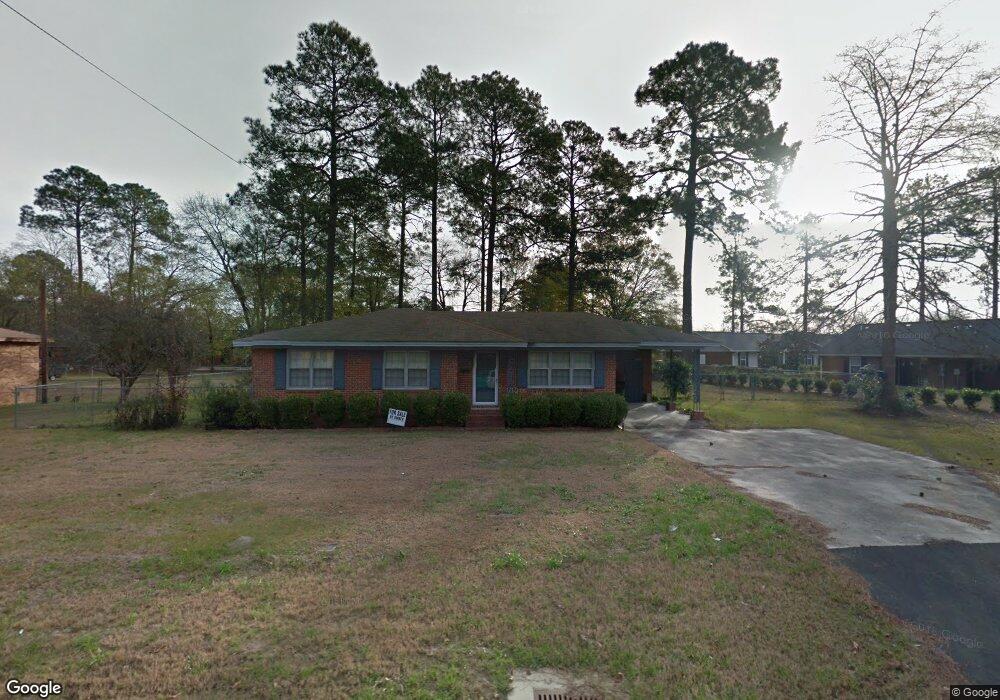
504 N Pecan St Cordele, GA 31015
Estimated Value: $119,000 - $136,464
3
Beds
2
Baths
1,374
Sq Ft
$94/Sq Ft
Est. Value
About This Home
This home is located at 504 N Pecan St, Cordele, GA 31015 and is currently estimated at $128,866, approximately $93 per square foot. 504 N Pecan St is a home located in Crisp County with nearby schools including Crisp County Elementary School, Crisp County Primary School, and Crisp County Middle School.
Ownership History
Date
Name
Owned For
Owner Type
Purchase Details
Closed on
Nov 28, 2017
Sold by
Duckworth Tommy L
Bought by
Hall John
Current Estimated Value
Home Financials for this Owner
Home Financials are based on the most recent Mortgage that was taken out on this home.
Original Mortgage
$75,859
Outstanding Balance
$65,506
Interest Rate
5.25%
Mortgage Type
FHA
Estimated Equity
$63,360
Purchase Details
Closed on
Feb 27, 2007
Sold by
Duckworth Jimmy E
Bought by
Duckworth Tommy L
Purchase Details
Closed on
Jan 12, 2007
Sold by
Duckworth Dorothy
Bought by
Duckworth Tommy and Duckworth Jimmy E
Purchase Details
Closed on
Sep 20, 1996
Sold by
Duckworth Dorothy
Bought by
Duckworth Tommie L
Purchase Details
Closed on
Sep 12, 1996
Sold by
Mccay George E
Bought by
Sammon Amanda and Sammon Rho
Purchase Details
Closed on
Jun 5, 1978
Sold by
Arthur Rob and Arthur Anna
Bought by
Mccay George E
Create a Home Valuation Report for This Property
The Home Valuation Report is an in-depth analysis detailing your home's value as well as a comparison with similar homes in the area
Home Values in the Area
Average Home Value in this Area
Purchase History
| Date | Buyer | Sale Price | Title Company |
|---|---|---|---|
| Hall John | $77,260 | -- | |
| Duckworth Tommy L | -- | -- | |
| Duckworth Tommy | -- | -- | |
| Duckworth Tommie L | -- | -- | |
| Duckworth Dorothy | $58,000 | -- | |
| Sammon Amanda | -- | -- | |
| Mccay George E | $38,200 | -- |
Source: Public Records
Mortgage History
| Date | Status | Borrower | Loan Amount |
|---|---|---|---|
| Open | Hall John | $75,859 |
Source: Public Records
Tax History Compared to Growth
Tax History
| Year | Tax Paid | Tax Assessment Tax Assessment Total Assessment is a certain percentage of the fair market value that is determined by local assessors to be the total taxable value of land and additions on the property. | Land | Improvement |
|---|---|---|---|---|
| 2025 | $1,430 | $43,697 | $5,276 | $38,421 |
| 2024 | $1,430 | $39,908 | $5,276 | $34,632 |
| 2023 | $1,326 | $35,376 | $2,638 | $32,738 |
| 2022 | $885 | $33,482 | $2,638 | $30,844 |
| 2021 | $867 | $31,588 | $2,638 | $28,950 |
| 2020 | $889 | $31,588 | $2,638 | $28,950 |
| 2019 | $896 | $31,588 | $2,638 | $28,950 |
| 2018 | $836 | $28,379 | $3,956 | $24,423 |
| 2017 | $1,152 | $28,379 | $3,956 | $24,423 |
| 2016 | $839 | $28,379 | $3,956 | $24,423 |
| 2015 | -- | $28,380 | $3,956 | $24,423 |
| 2014 | -- | $28,380 | $3,956 | $24,423 |
| 2013 | -- | $28,379 | $3,956 | $24,423 |
Source: Public Records
Map
Nearby Homes
- 508 N Pecan St
- 1015 E Tulip Ave
- 512 N Pecan St
- 1012 E 6th Ave
- C30 007 Tbd Corner of East 13th Ave & Greer St S
- 602 N Pecan St
- A N Pecan St
- 1013 E 8th Ave
- 1008 E 6th Ave
- 1007 E Tulip Ave
- 1009 E 8th Ave
- 603 N Pecan St
- 606 N Pecan St
- 610 N Pecan St
- 1004 E 6th Ave
- 1007 E 8th Ave
- 1005 E Tulip Ave
- 1011 E 6th Ave
- 906 E 6th Ave
- 615 Cardinal Ave