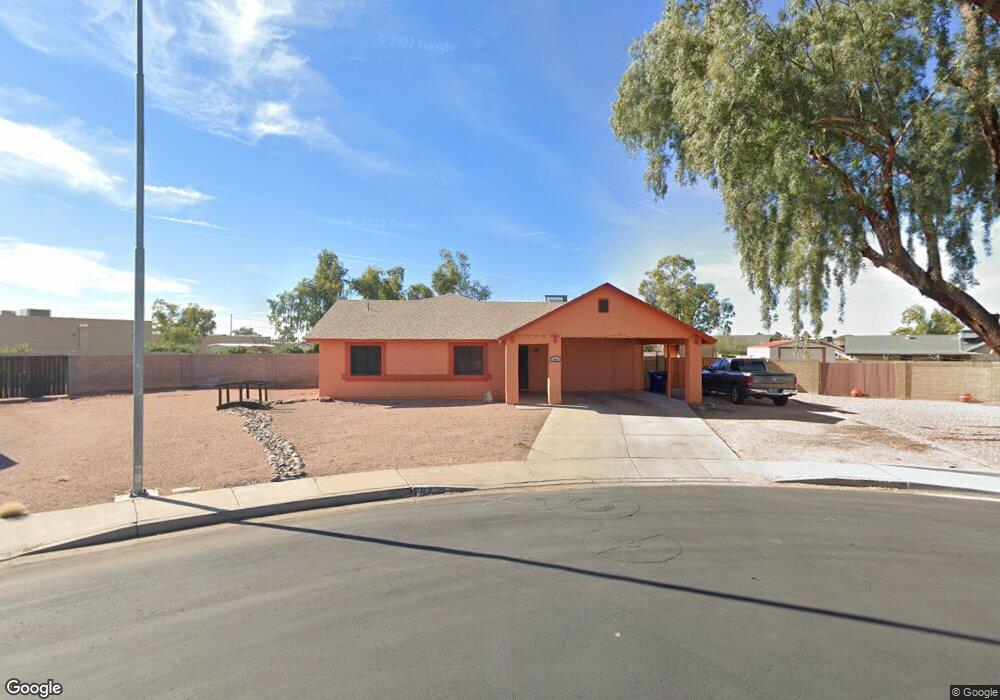
504 N York Mesa, AZ 85213
North Central Mesa NeighborhoodEstimated Value: $538,068 - $718,000
--
Bed
2
Baths
2,892
Sq Ft
$221/Sq Ft
Est. Value
About This Home
This home is located at 504 N York, Mesa, AZ 85213 and is currently estimated at $639,017, approximately $220 per square foot. 504 N York is a home located in Maricopa County with nearby schools including Field Elementary School, Franklin at Brimhall Elementary School, and Franklin West Elementary School.
Ownership History
Date
Name
Owned For
Owner Type
Purchase Details
Closed on
May 16, 2019
Sold by
Padberg Theresa M and Padberg Stephen L
Bought by
Padberg Theresa M and Padberg Stephen L
Current Estimated Value
Purchase Details
Closed on
Aug 17, 2006
Sold by
Williams Rosemay C
Bought by
Williams Rosemary C
Home Financials for this Owner
Home Financials are based on the most recent Mortgage that was taken out on this home.
Original Mortgage
$129,949
Interest Rate
6.76%
Mortgage Type
Purchase Money Mortgage
Purchase Details
Closed on
Jan 6, 2004
Sold by
Williams Rosemary C
Bought by
Williams Rosemary C and Rosemary C Williams Revocable Living Tr
Create a Home Valuation Report for This Property
The Home Valuation Report is an in-depth analysis detailing your home's value as well as a comparison with similar homes in the area
Home Values in the Area
Average Home Value in this Area
Purchase History
| Date | Buyer | Sale Price | Title Company |
|---|---|---|---|
| Padberg Theresa M | -- | None Available | |
| Williams Rosemary C | -- | The Talon Group Tempe Supers | |
| Williams Rosemary C | -- | -- |
Source: Public Records
Mortgage History
| Date | Status | Borrower | Loan Amount |
|---|---|---|---|
| Closed | Williams Rosemary C | $129,949 |
Source: Public Records
Tax History Compared to Growth
Tax History
| Year | Tax Paid | Tax Assessment Tax Assessment Total Assessment is a certain percentage of the fair market value that is determined by local assessors to be the total taxable value of land and additions on the property. | Land | Improvement |
|---|---|---|---|---|
| 2025 | $2,127 | $25,606 | -- | -- |
| 2024 | $2,150 | $24,386 | -- | -- |
| 2023 | $2,150 | $38,380 | $7,670 | $30,710 |
| 2022 | $2,103 | $30,470 | $6,090 | $24,380 |
| 2021 | $2,160 | $30,530 | $6,100 | $24,430 |
| 2020 | $1,303 | $18,320 | $3,660 | $14,660 |
| 2019 | $1,207 | $17,930 | $3,580 | $14,350 |
| 2018 | $1,152 | $16,010 | $3,200 | $12,810 |
| 2017 | $1,116 | $14,780 | $2,950 | $11,830 |
| 2016 | $1,096 | $14,000 | $2,800 | $11,200 |
| 2015 | $1,035 | $10,510 | $2,100 | $8,410 |
Source: Public Records
Map
Nearby Homes
- 2607 E Camino St
- 2610 E University Dr
- 645 N Windsor
- 2458 E University Dr Unit 2
- 721 N 25th St
- 306 N Winthrop Cir
- 2459 E Baltimore St
- 2416 E University Dr Unit 4
- 2450 E Adobe St
- 2708 E 2nd St
- 148 N Glenview
- 2433 E Enrose St
- 3020 E Des Moines St
- 3020 E Main St Unit G97
- 3020 E Main St Unit V98
- 3020 E Main St Unit H-012
- 3020 E Main St Unit D17
- 3020 E Main St Unit D31
- 3020 E Main St Unit 23
- 3020 E Main St Unit J44
- 516 N York
- 2727 E Contessa St
- 505 N Yale
- 463 N Yale
- 517 N Yale
- 111 N Mesquite Dr
- 457 N Yale
- 528 N York
- 2733 E Contessa St
- 2728 E Contessa St
- 529 N Yale
- 451 N Yale
- 2734 E Contessa St
- 2739 E Contessa St
- 2657 E Contessa St
- 2658 E Contessa St
- 2656 E Camino St
- 2659 E Covina St
- 539 N York
- 2714 E Covina St