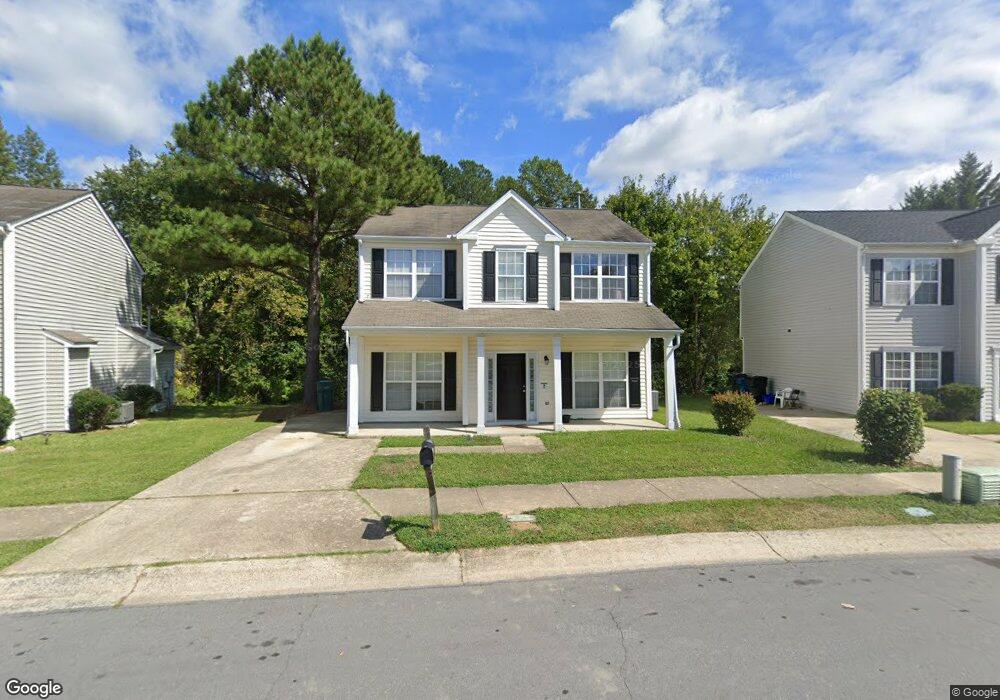
504 Quartz Dr Durham, NC 27703
Eastern Durham NeighborhoodEstimated Value: $313,000 - $358,000
4
Beds
3
Baths
1,789
Sq Ft
$192/Sq Ft
Est. Value
About This Home
This home is located at 504 Quartz Dr, Durham, NC 27703 and is currently estimated at $344,088, approximately $192 per square foot. 504 Quartz Dr is a home located in Durham County with nearby schools including Glenn Elementary, John W Neal Middle School, and Southern School of Energy & Sustainability.
Ownership History
Date
Name
Owned For
Owner Type
Purchase Details
Closed on
Aug 18, 2016
Sold by
Prestige Home Solutions Ll
Bought by
Jones Tevin L and Jones Shakemia E
Current Estimated Value
Home Financials for this Owner
Home Financials are based on the most recent Mortgage that was taken out on this home.
Original Mortgage
$171,900
Outstanding Balance
$140,461
Interest Rate
4.25%
Mortgage Type
New Conventional
Estimated Equity
$203,627
Purchase Details
Closed on
Jun 1, 2016
Sold by
W Investments Llc
Bought by
Prestige Home Solutions Llc
Purchase Details
Closed on
Aug 13, 1998
Sold by
Pulte Home Corp
Bought by
Whittington Dawayne and Whittington Joi
Home Financials for this Owner
Home Financials are based on the most recent Mortgage that was taken out on this home.
Original Mortgage
$115,845
Interest Rate
6.9%
Mortgage Type
FHA
Create a Home Valuation Report for This Property
The Home Valuation Report is an in-depth analysis detailing your home's value as well as a comparison with similar homes in the area
Home Values in the Area
Average Home Value in this Area
Purchase History
| Date | Buyer | Sale Price | Title Company |
|---|---|---|---|
| Jones Tevin L | $170,000 | -- | |
| Prestige Home Solutions Llc | $135,500 | -- | |
| Whittington Dawayne | $117,000 | -- |
Source: Public Records
Mortgage History
| Date | Status | Borrower | Loan Amount |
|---|---|---|---|
| Open | Jones Tevin L | $171,900 | |
| Previous Owner | Whittington Dawayne | $115,845 |
Source: Public Records
Tax History
| Year | Tax Paid | Tax Assessment Tax Assessment Total Assessment is a certain percentage of the fair market value that is determined by local assessors to be the total taxable value of land and additions on the property. | Land | Improvement |
|---|---|---|---|---|
| 2025 | $3,513 | $354,409 | $106,200 | $248,209 |
| 2024 | $2,433 | $174,389 | $29,600 | $144,789 |
| 2023 | $2,284 | $174,389 | $29,600 | $144,789 |
| 2022 | $2,232 | $174,389 | $29,600 | $144,789 |
| 2021 | $2,222 | $174,389 | $29,600 | $144,789 |
| 2020 | $2,169 | $174,389 | $29,600 | $144,789 |
| 2019 | $2,169 | $174,389 | $29,600 | $144,789 |
| 2018 | $2,061 | $151,901 | $23,680 | $128,221 |
| 2017 | $2,045 | $151,901 | $23,680 | $128,221 |
| 2016 | $1,976 | $151,901 | $23,680 | $128,221 |
| 2015 | $2,046 | $147,829 | $27,202 | $120,627 |
| 2014 | $2,046 | $147,829 | $27,202 | $120,627 |
Source: Public Records
Map
Nearby Homes
- 502 Quartz Dr
- 521 Quartz Dr
- 507 Lodestone Dr
- 3708 Thornwood Dr
- 3702 Turquoise Dr
- 3602 Thornwood Dr
- 608 Chalcedony Ct
- 412 Maymont Dr
- 3511 Thornwood Dr
- 10 Bentwood Place
- 403 Chadbourne Dr
- 1011 Homecoming Way
- 709 Grandview Dr
- 4505 Tyne Dr
- 3409 Judy Ave
- 1113 Homecoming Way
- 914 Flanders Dr
- 1113 Kindness Ln
- 110 Kindlewood Dr
- 1060 Gentle Reed Dr
Your Personal Tour Guide
Ask me questions while you tour the home.