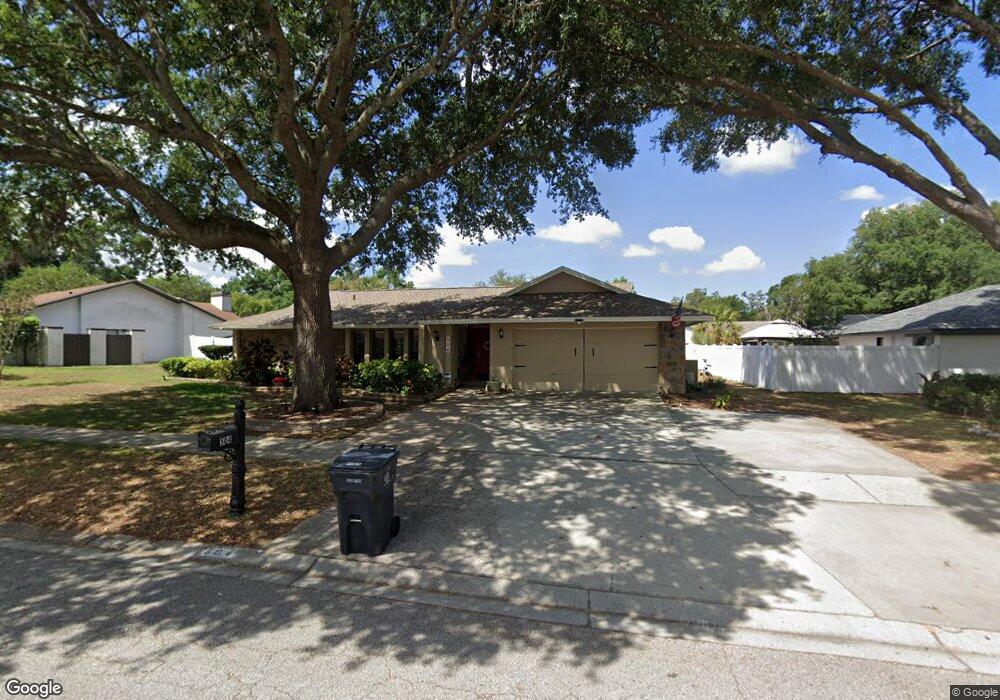
504 Running Horse Rd Seffner, FL 33584
Estimated Value: $452,317 - $519,000
3
Beds
2
Baths
3,132
Sq Ft
$153/Sq Ft
Est. Value
About This Home
This home is located at 504 Running Horse Rd, Seffner, FL 33584 and is currently estimated at $479,579, approximately $153 per square foot. 504 Running Horse Rd is a home located in Hillsborough County with nearby schools including Lopez Elementary School, Burnett Middle School, and Strawberry Crest High School.
Ownership History
Date
Name
Owned For
Owner Type
Purchase Details
Closed on
Feb 11, 2011
Sold by
American General Home Equity Inc
Bought by
Parks Larry and Parks Maria L
Current Estimated Value
Home Financials for this Owner
Home Financials are based on the most recent Mortgage that was taken out on this home.
Original Mortgage
$126,000
Interest Rate
4.95%
Mortgage Type
New Conventional
Purchase Details
Closed on
Sep 17, 2010
Sold by
Stetson Robert H
Bought by
American General Home Equity Inc
Purchase Details
Closed on
Oct 8, 1998
Sold by
Lavigne Andrew W and Lavigne L
Bought by
Stetson Robert H and Stetson Lisa L
Purchase Details
Closed on
Aug 19, 1994
Sold by
Oneill James F and Oneill Diane C
Bought by
Lavigne Andrew W and Lavigne Elizabeth Lynn
Home Financials for this Owner
Home Financials are based on the most recent Mortgage that was taken out on this home.
Original Mortgage
$109,350
Interest Rate
8.74%
Create a Home Valuation Report for This Property
The Home Valuation Report is an in-depth analysis detailing your home's value as well as a comparison with similar homes in the area
Home Values in the Area
Average Home Value in this Area
Purchase History
| Date | Buyer | Sale Price | Title Company |
|---|---|---|---|
| Parks Larry | $157,500 | Hillsborough Title Llc | |
| American General Home Equity Inc | -- | None Available | |
| Stetson Robert H | $129,900 | -- | |
| Lavigne Andrew W | $121,500 | -- |
Source: Public Records
Mortgage History
| Date | Status | Borrower | Loan Amount |
|---|---|---|---|
| Previous Owner | Parks Larry | $126,000 | |
| Previous Owner | Lavigne Andrew W | $109,350 | |
| Closed | Stetson Robert H | $0 | |
| Closed | Stetson Robert H | $19,485 |
Source: Public Records
Tax History Compared to Growth
Tax History
| Year | Tax Paid | Tax Assessment Tax Assessment Total Assessment is a certain percentage of the fair market value that is determined by local assessors to be the total taxable value of land and additions on the property. | Land | Improvement |
|---|---|---|---|---|
| 2024 | $6,311 | $361,671 | -- | -- |
| 2023 | $6,220 | $351,137 | $0 | $0 |
| 2022 | $5,952 | $339,823 | $71,057 | $268,766 |
| 2021 | $5,423 | $270,600 | $56,846 | $213,754 |
| 2020 | $4,800 | $235,041 | $42,634 | $192,407 |
| 2019 | $4,799 | $236,846 | $41,924 | $194,922 |
| 2018 | $4,698 | $231,551 | $0 | $0 |
| 2017 | $4,504 | $220,035 | $0 | $0 |
| 2016 | $4,345 | $207,806 | $0 | $0 |
| 2015 | $4,201 | $192,252 | $0 | $0 |
| 2014 | $3,911 | $174,775 | $0 | $0 |
| 2013 | -- | $158,886 | $0 | $0 |
Source: Public Records
Map
Nearby Homes
- 502 Sportsman Park Dr
- 506 Gay Rd
- 613 Sportsman Park Dr
- 904 Check Place
- 801 Chess Place
- 107 Halton Cir
- 422 Down Pine Dr
- 616 Pawn Way
- 704 Queens Ct
- 709 Sportsman Park Dr
- 102 Alafara St
- 605 de Resine Carre St Unit 605DR
- 807 Old Darby St
- 712 Sportsman Park Dr
- 1008 Shangri la Dr
- 1005 Shangri la Dr
- 918 John Cressler Dr
- 1009 Shangri la Dr
- 503 de Resine Carre St Unit 503DR
- 306 Red Elm Place
- 506 Running Horse Rd
- 502 Running Horse Rd
- 503 Sportsman Park Dr
- 508 Running Horse Rd
- 503 Running Horse Rd
- 505 Sportsman Park Dr
- 505 Running Horse Rd
- 602 Penn National Rd
- 503 Penn National Rd
- 505 Penn National Rd
- 510 Running Horse Rd
- 501 Penn National Rd
- 507 Sportsman Park Dr
- 507 Running Horse Rd
- 405 Running Horse Rd
- 411 Penn National Rd
- 504 Sportsman Park Dr
- 604 Penn National Rd
- 509 Sportsman Park Dr
- 504 Triple Crown Ct