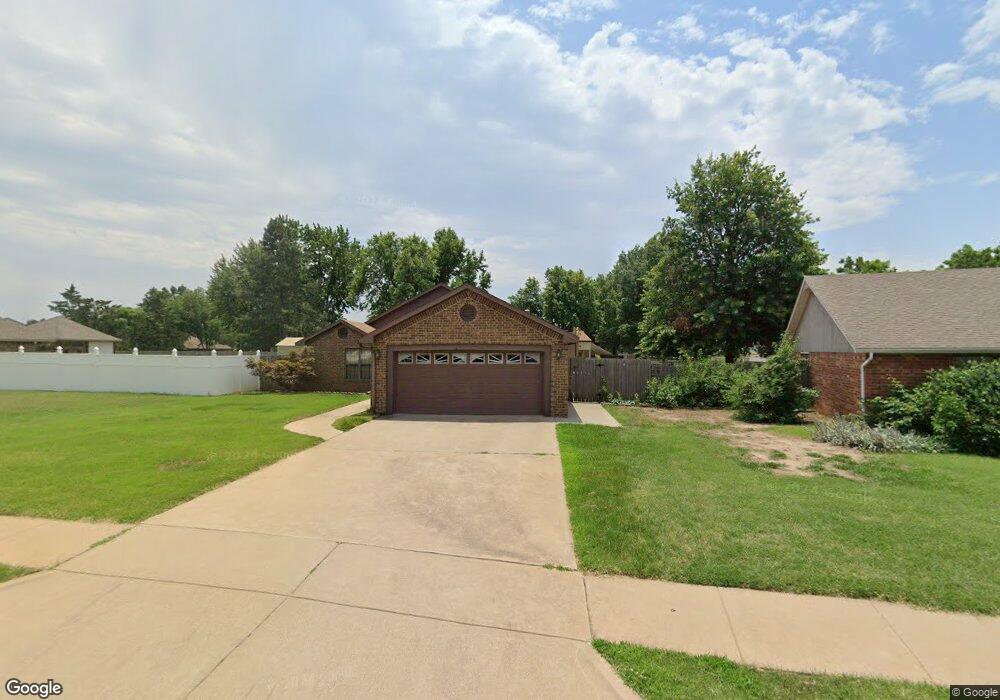
504 Shannon Rd Ponca City, OK 74601
Estimated Value: $197,000 - $225,000
3
Beds
2
Baths
1,795
Sq Ft
$117/Sq Ft
Est. Value
About This Home
This home is located at 504 Shannon Rd, Ponca City, OK 74601 and is currently estimated at $209,562, approximately $116 per square foot. 504 Shannon Rd is a home located in Kay County with nearby schools including Union Elementary School, Ponca City East Middle School, and Ponca City West Middle School.
Ownership History
Date
Name
Owned For
Owner Type
Purchase Details
Closed on
Sep 5, 2023
Sold by
Blackwill Michele and Blackwill Leonard
Bought by
Brown Keagan Marshal and Moreland Brianne Chalis
Current Estimated Value
Home Financials for this Owner
Home Financials are based on the most recent Mortgage that was taken out on this home.
Original Mortgage
$175,266
Outstanding Balance
$171,443
Interest Rate
6.81%
Mortgage Type
FHA
Estimated Equity
$38,119
Purchase Details
Closed on
Dec 10, 2018
Sold by
Dvorak Linda M and Blackwill Michele
Bought by
Dvorak Linda M and Blackwill Michele
Purchase Details
Closed on
Jul 10, 2018
Sold by
Luton Phyllis K and Gatzemeyer Meredith Lowe
Bought by
Dvorak Linda M and Blackwill Michele
Purchase Details
Closed on
Apr 7, 1993
Sold by
Cleata Ronald and Cleata Mccleary
Bought by
Phyllis John and Phyllis Luton
Create a Home Valuation Report for This Property
The Home Valuation Report is an in-depth analysis detailing your home's value as well as a comparison with similar homes in the area
Home Values in the Area
Average Home Value in this Area
Purchase History
| Date | Buyer | Sale Price | Title Company |
|---|---|---|---|
| Brown Keagan Marshal | $178,500 | First American Title Insurance | |
| Dvorak Linda M | -- | None Available | |
| Dvorak Linda M | $124,000 | None Available | |
| Phyllis John | $92,000 | -- |
Source: Public Records
Mortgage History
| Date | Status | Borrower | Loan Amount |
|---|---|---|---|
| Open | Brown Keagan Marshal | $175,266 |
Source: Public Records
Tax History Compared to Growth
Tax History
| Year | Tax Paid | Tax Assessment Tax Assessment Total Assessment is a certain percentage of the fair market value that is determined by local assessors to be the total taxable value of land and additions on the property. | Land | Improvement |
|---|---|---|---|---|
| 2024 | $2,164 | $22,859 | $1,448 | $21,411 |
| 2023 | $2,164 | $13,640 | $927 | $12,713 |
| 2022 | $1,108 | $13,640 | $1,408 | $12,232 |
| 2021 | $1,113 | $13,640 | $1,408 | $12,232 |
| 2020 | $1,102 | $13,640 | $1,408 | $12,232 |
| 2019 | $1,112 | $13,640 | $1,448 | $12,192 |
| 2018 | $1,218 | $13,575 | $1,448 | $12,127 |
| 2017 | $1,256 | $13,815 | $1,437 | $12,378 |
| 2016 | $1,229 | $13,413 | $1,378 | $12,035 |
| 2015 | $1,196 | $13,022 | $1,351 | $11,671 |
| 2014 | $1,136 | $12,642 | $1,158 | $11,484 |
Source: Public Records
Map
Nearby Homes
- TBD 5th and Windsor
- 1009 Brentwood Dr
- 120 E Woodbury Rd
- 3651 N 14th St
- 2000 N 5th St
- 2005 N 4th St
- 0000 N Union St
- 3019 Meadow Ln
- 1704 Fairway Place
- 3013 Kingston Rd
- 1703 Leslie Ln
- 1128 N 14th St
- 3205 Kingston Rd
- 3602 N 14th
- 1412 Donahoe Dr
- 304 E Detroit Ave
- 2223 Turner St
- 2117 Ashley Place
- 1600 Monument Rd
- 2023 Turner St
- 500 Shannon Rd
- 512 Shannon Rd
- 516 Shannon Rd
- 501 Shannon Rd
- 2527 Windsor Rd
- 2535 Windsor Rd
- 2531 Windsor Rd
- 2529 Windsor Rd
- 2525 Windsor Rd
- 2533 Windsor Rd
- 509 Shannon Rd
- 520 Shannon Rd
- 2601 Windsor Rd
- 2521 Windsor Rd
- 513 Shannon Rd
- 2519 Windsor Rd
- 2523 Windsor Rd
- 524 Shannon Rd
- 2517 Windsor Rd
- 517 Shannon Rd