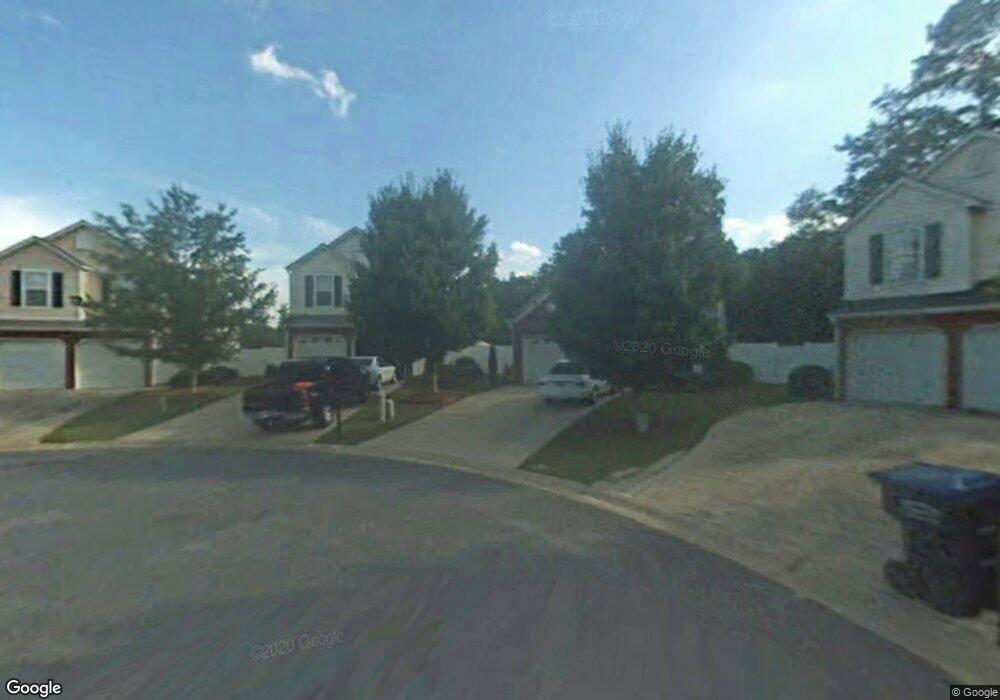
504 Stanford Place Unit 2 Woodstock, GA 30188
Estimated Value: $331,396 - $357,000
3
Beds
3
Baths
1,276
Sq Ft
$270/Sq Ft
Est. Value
About This Home
This home is located at 504 Stanford Place Unit 2, Woodstock, GA 30188 and is currently estimated at $344,198, approximately $269 per square foot. 504 Stanford Place Unit 2 is a home located in Cherokee County with nearby schools including Arnold Mill Elementary School, Mill Creek Middle School, and River Ridge High School.
Ownership History
Date
Name
Owned For
Owner Type
Purchase Details
Closed on
Jan 17, 2006
Sold by
Fennell Julie A
Bought by
St Vrain Joel M
Current Estimated Value
Home Financials for this Owner
Home Financials are based on the most recent Mortgage that was taken out on this home.
Original Mortgage
$138,900
Outstanding Balance
$77,346
Interest Rate
6.21%
Mortgage Type
FHA
Estimated Equity
$266,852
Purchase Details
Closed on
May 12, 2003
Sold by
Fennell Julie
Bought by
Fennell Julie A
Home Financials for this Owner
Home Financials are based on the most recent Mortgage that was taken out on this home.
Original Mortgage
$113,500
Interest Rate
4.25%
Mortgage Type
New Conventional
Purchase Details
Closed on
Jul 17, 1999
Sold by
Calumet Homes Lp
Bought by
Fennell Julie
Home Financials for this Owner
Home Financials are based on the most recent Mortgage that was taken out on this home.
Original Mortgage
$115,150
Interest Rate
7.79%
Mortgage Type
New Conventional
Create a Home Valuation Report for This Property
The Home Valuation Report is an in-depth analysis detailing your home's value as well as a comparison with similar homes in the area
Home Values in the Area
Average Home Value in this Area
Purchase History
| Date | Buyer | Sale Price | Title Company |
|---|---|---|---|
| St Vrain Joel M | $140,000 | -- | |
| Fennell Julie A | -- | -- | |
| Fennell Julie | $118,800 | -- |
Source: Public Records
Mortgage History
| Date | Status | Borrower | Loan Amount |
|---|---|---|---|
| Open | St Vrain Joel M | $138,900 | |
| Previous Owner | Fennell Julie A | $113,500 | |
| Previous Owner | Fennell Julie | $115,150 |
Source: Public Records
Tax History Compared to Growth
Tax History
| Year | Tax Paid | Tax Assessment Tax Assessment Total Assessment is a certain percentage of the fair market value that is determined by local assessors to be the total taxable value of land and additions on the property. | Land | Improvement |
|---|---|---|---|---|
| 2025 | $3,092 | $135,368 | $25,200 | $110,168 |
| 2024 | $3,006 | $131,800 | $25,200 | $106,600 |
| 2023 | $2,783 | $119,628 | $24,000 | $95,628 |
| 2022 | $2,479 | $105,376 | $20,000 | $85,376 |
| 2021 | $2,326 | $89,844 | $16,000 | $73,844 |
| 2020 | $2,106 | $80,272 | $12,000 | $68,272 |
| 2019 | $1,989 | $75,240 | $12,000 | $63,240 |
| 2018 | $1,718 | $63,160 | $12,000 | $51,160 |
| 2017 | $1,614 | $145,700 | $12,000 | $46,280 |
| 2016 | $1,478 | $132,700 | $9,600 | $43,480 |
| 2015 | $1,419 | $126,400 | $9,600 | $40,960 |
| 2014 | $1,260 | $112,700 | $9,600 | $35,480 |
Source: Public Records
Map
Nearby Homes
- 506 Stanford Place
- 502 Stanford Place Unit 2
- 407 Rankin Ct Unit 2
- 508 Stanford Place Unit 2
- 500 Stanford Place
- 406 Rankin Ct
- 405 Rankin Ct
- 510 Stanford Place
- 501 Stanford Place
- 404 Rankin Ct Unit 2
- 512 Stanford Place Unit 2
- 0 Stanford Place Unit 7525437
- 0 Stanford Place Unit 7510144
- 0 Stanford Place Unit 7398715
- 0 Stanford Place Unit 7028590
- 0 Stanford Place Unit 8745239
- 0 Stanford Place Unit 8722703
- 0 Stanford Place Unit 8672982
- 0 Stanford Place Unit 8552289
- 0 Stanford Place