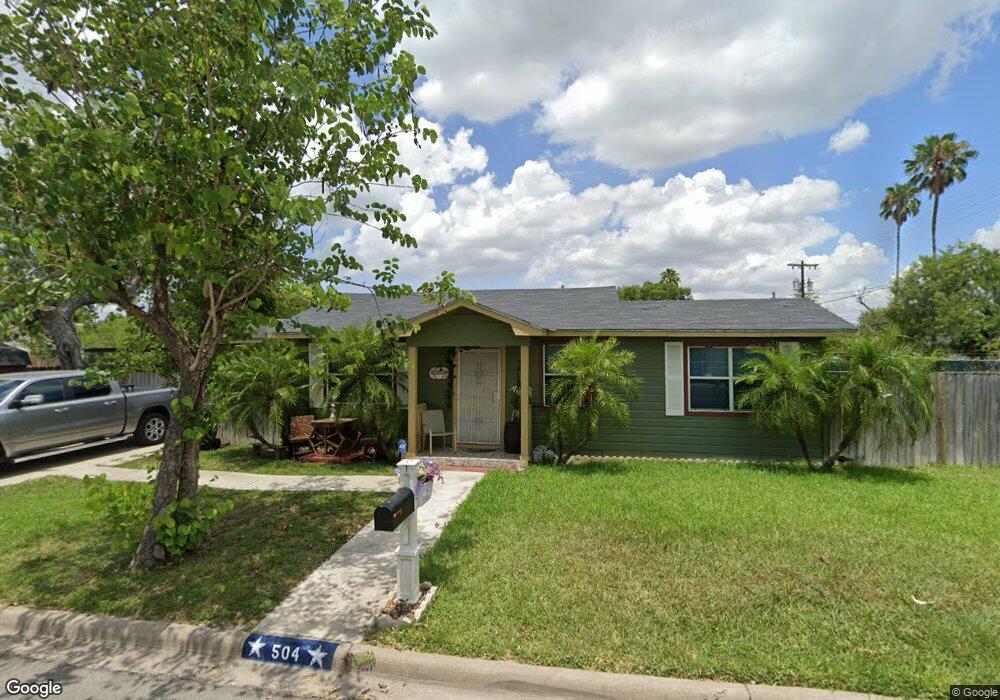
504 Tula Ave Weslaco, TX 78596
Estimated Value: $95,484 - $127,000
3
Beds
3
Baths
804
Sq Ft
$138/Sq Ft
Est. Value
About This Home
This home is located at 504 Tula Ave, Weslaco, TX 78596 and is currently estimated at $111,121, approximately $138 per square foot. 504 Tula Ave is a home located in Hidalgo County with nearby schools including Central Middle School, Weslaco High School, and Mid Valley Christian School.
Ownership History
Date
Name
Owned For
Owner Type
Purchase Details
Closed on
Jul 15, 2013
Sold by
City Of Weslaco
Bought by
Puga Dalia
Current Estimated Value
Purchase Details
Closed on
Apr 3, 2006
Sold by
Espinosa Marcelino and Espinosa Guadalupe
Bought by
Puga Dalia Solis
Home Financials for this Owner
Home Financials are based on the most recent Mortgage that was taken out on this home.
Original Mortgage
$22,000
Interest Rate
6.22%
Mortgage Type
Purchase Money Mortgage
Create a Home Valuation Report for This Property
The Home Valuation Report is an in-depth analysis detailing your home's value as well as a comparison with similar homes in the area
Home Values in the Area
Average Home Value in this Area
Purchase History
| Date | Buyer | Sale Price | Title Company |
|---|---|---|---|
| Puga Dalia | -- | None Available | |
| Puga Dalia Solis | -- | Charge San Jacinto Title Ser |
Source: Public Records
Mortgage History
| Date | Status | Borrower | Loan Amount |
|---|---|---|---|
| Previous Owner | Puga Dalia Solis | $22,000 |
Source: Public Records
Tax History Compared to Growth
Tax History
| Year | Tax Paid | Tax Assessment Tax Assessment Total Assessment is a certain percentage of the fair market value that is determined by local assessors to be the total taxable value of land and additions on the property. | Land | Improvement |
|---|---|---|---|---|
| 2025 | $623 | $69,216 | -- | -- |
| 2024 | $623 | $62,924 | -- | -- |
| 2023 | $1,446 | $57,204 | $0 | $0 |
| 2022 | $1,331 | $52,004 | $0 | $0 |
| 2021 | $1,229 | $47,276 | $24,406 | $22,870 |
| 2020 | $1,149 | $43,058 | $24,406 | $18,652 |
| 2019 | $872 | $31,956 | $21,313 | $10,643 |
| 2018 | $974 | $35,595 | $21,313 | $14,282 |
| 2017 | $970 | $35,595 | $21,313 | $14,282 |
| 2016 | $879 | $32,233 | $22,000 | $10,233 |
| 2015 | $975 | $32,233 | $22,000 | $10,233 |
Source: Public Records
Map
Nearby Homes