T
Landlord's Agent in 2025
Tonya Teaney
Inactive Office
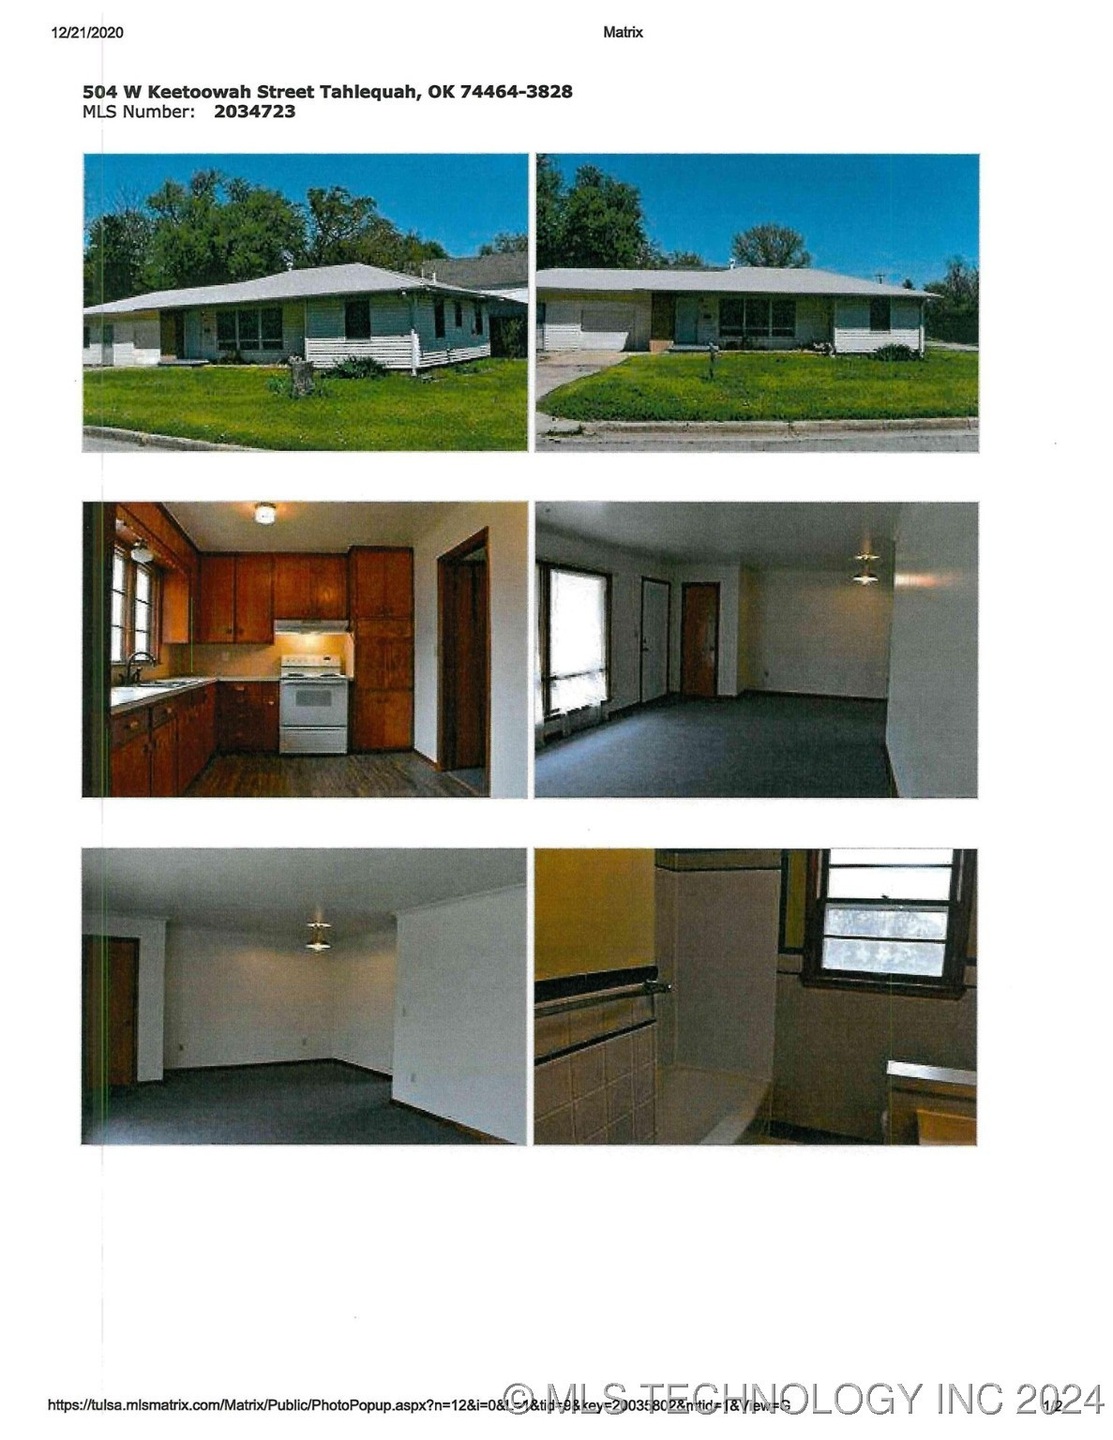
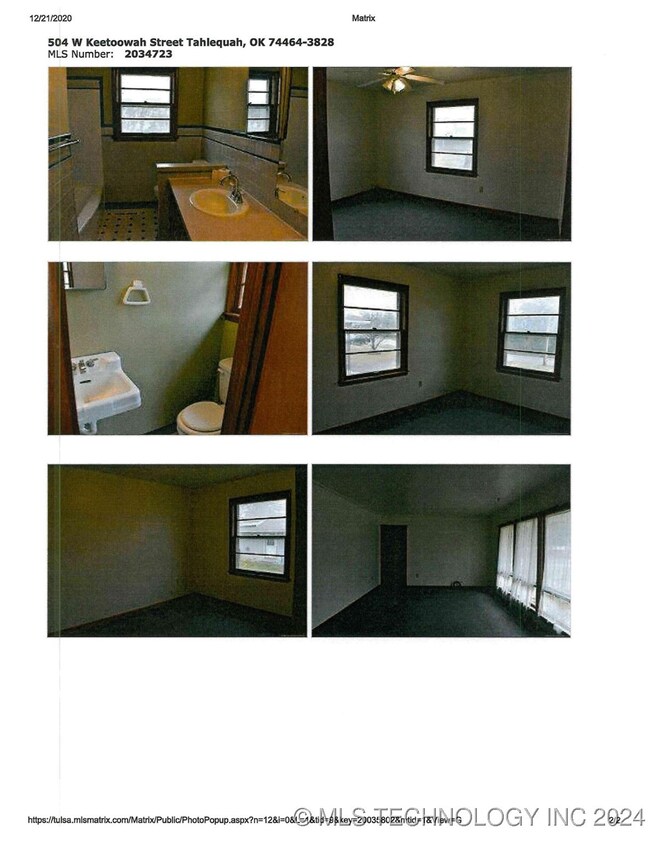
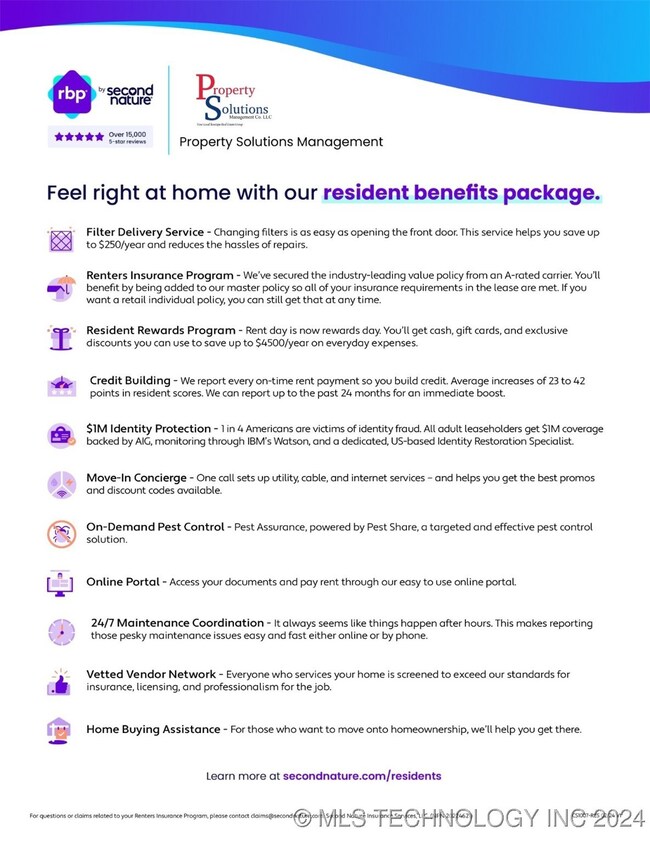
Charming 3 bedroom, 1 1/2 bath home with spacious living room, central heat & air, new paint through-out entire home, brand new roof, laundry hook ups, 1 car garage. Convenient to Tahlequah High School and down town Tahlequah. No pets. Additional $50 to be applied for Resident Benefit Package.
Last Agent to Rent the Property
Tonya Teaney
Inactive Office Listed on: 11/07/2024
| Date | Buyer | Sale Price | Title Company |
|---|---|---|---|
| Lanza Joseph Dennis | -- | None Available |
| Date | Event | Price | List to Sale | Price per Sq Ft | Prior Sale |
|---|---|---|---|---|---|
| 01/20/2025 01/20/25 | Rented | $1,025 | 0.0% | -- | |
| 11/07/2024 11/07/24 | For Rent | $1,025 | 0.0% | -- | |
| 06/30/2023 06/30/23 | Sold | $134,600 | -10.2% | $127 / Sq Ft | View Prior Sale |
| 04/14/2023 04/14/23 | Pending | -- | -- | -- | |
| 04/14/2023 04/14/23 | For Sale | $149,900 | 0.0% | $141 / Sq Ft | |
| 09/23/2020 09/23/20 | Rented | $800 | 0.0% | -- | |
| 09/18/2020 09/18/20 | Under Contract | -- | -- | -- | |
| 09/18/2020 09/18/20 | For Rent | $800 | 0.0% | -- | |
| 04/25/2020 04/25/20 | Rented | $800 | 0.0% | -- | |
| 04/09/2020 04/09/20 | Under Contract | -- | -- | -- | |
| 04/09/2020 04/09/20 | For Rent | $800 | 0.0% | -- | |
| 02/26/2020 02/26/20 | Rented | $800 | 0.0% | -- | |
| 02/12/2020 02/12/20 | Under Contract | -- | -- | -- | |
| 02/12/2020 02/12/20 | For Rent | $800 | -- | -- |
| Year | Tax Paid | Tax Assessment Tax Assessment Total Assessment is a certain percentage of the fair market value that is determined by local assessors to be the total taxable value of land and additions on the property. | Land | Improvement |
|---|---|---|---|---|
| 2025 | $507 | $5,112 | $661 | $4,451 |
| 2024 | $507 | $5,351 | $661 | $4,690 |
| 2023 | $507 | $5,889 | $637 | $5,252 |
| 2022 | $520 | $5,609 | $607 | $5,002 |
| 2021 | $497 | $5,342 | $578 | $4,764 |
| 2020 | $482 | $5,088 | $550 | $4,538 |
| 2019 | $455 | $4,845 | $524 | $4,321 |
| 2018 | $439 | $4,615 | $581 | $4,034 |
| 2017 | $417 | $4,395 | $553 | $3,842 |
| 2016 | $400 | $4,186 | $527 | $3,659 |
| 2015 | $357 | $3,987 | $522 | $3,465 |
| 2014 | $357 | $3,797 | $561 | $3,236 |
T
Landlord's Agent in 2025
Tonya Teaney
Inactive Office

Tenant's Agent in 2025
Melissa Poindexter
Property Solutions Real Estate
15 Total Sales
Seller's Agent in 2023
Angela Tinsley
Property Solutions Real Estate
(918) 457-6601
53 Total Sales
Seller's Agent in 2020
Beverly Jeanes
Coldwell Banker Select
(918) 931-9434
239 Total Sales
Source: MLS Technology
MLS Number: 2439292
APN: 3001-00-080-013-0-000-00
Disclaimer: Certain information contained herein is derived from information provided by parties other than Homes.com. All information provided is deemed reliable, but is not guaranteed to be accurate and should be independently verified.
![]() IDX information is provided exclusively for personal, non-commercial use, and may not be used for any purpose other than to identify prospective properties consumers may be interested in purchasing.
IDX information is provided exclusively for personal, non-commercial use, and may not be used for any purpose other than to identify prospective properties consumers may be interested in purchasing.
Information is deemed reliable but not guaranteed.