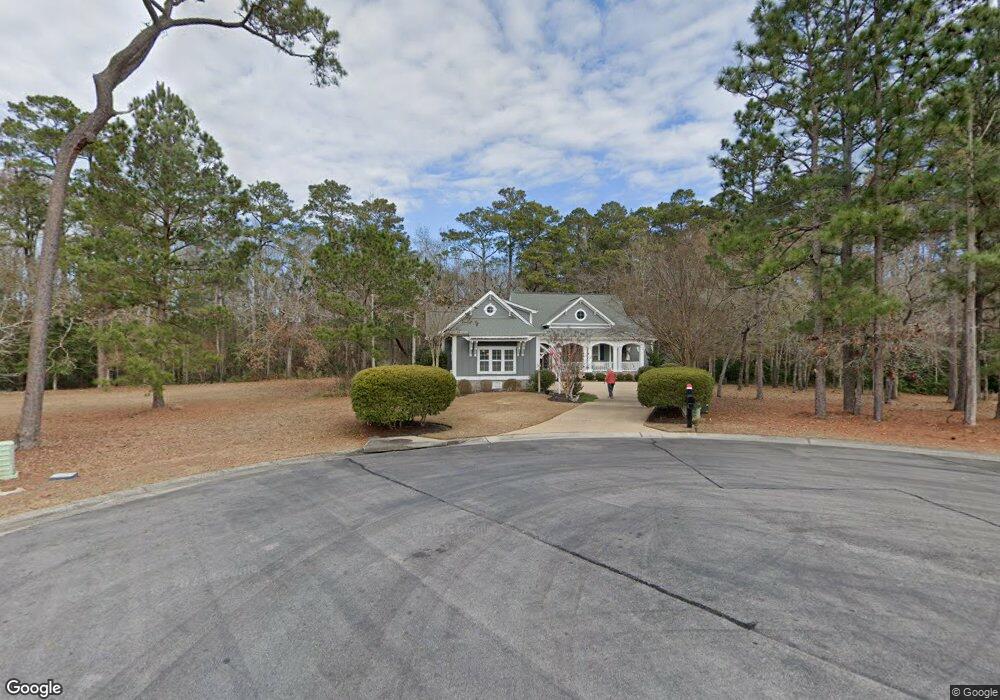
504 Westchester Place SW Ocean Isle Beach, NC 28469
Estimated Value: $776,887 - $1,093,000
4
Beds
3
Baths
2,957
Sq Ft
$309/Sq Ft
Est. Value
About This Home
This home is located at 504 Westchester Place SW, Ocean Isle Beach, NC 28469 and is currently estimated at $914,722, approximately $309 per square foot. 504 Westchester Place SW is a home located in Brunswick County with nearby schools including Union Elementary School, Shallotte Middle School, and West Brunswick High School.
Ownership History
Date
Name
Owned For
Owner Type
Purchase Details
Closed on
Mar 6, 2015
Sold by
Hagood Homes Inc
Bought by
Cowley Gregory and Cowley Joanne
Current Estimated Value
Home Financials for this Owner
Home Financials are based on the most recent Mortgage that was taken out on this home.
Original Mortgage
$204,900
Outstanding Balance
$157,280
Interest Rate
3.74%
Mortgage Type
New Conventional
Estimated Equity
$757,442
Purchase Details
Closed on
Jun 20, 2013
Sold by
Sanks Douglas and Sanks Deborah
Bought by
Hagood Homes Inc
Purchase Details
Closed on
Oct 21, 2011
Sold by
Bobik George Gary and Bobik Kum Cha
Bought by
Branch Banking & Trust Company
Purchase Details
Closed on
Sep 1, 2005
Sold by
Janosky Mark and Schomp Robert
Bought by
Bobick Gary and Bobick Kim Cha
Purchase Details
Closed on
Feb 28, 2005
Sold by
Vitelli Robert A and Vitelli Kathleen
Bought by
Janosky Mark and Schomp Robert
Create a Home Valuation Report for This Property
The Home Valuation Report is an in-depth analysis detailing your home's value as well as a comparison with similar homes in the area
Home Values in the Area
Average Home Value in this Area
Purchase History
| Date | Buyer | Sale Price | Title Company |
|---|---|---|---|
| Cowley Gregory | $530,000 | None Available | |
| Hagood Homes Inc | $75,000 | None Available | |
| Branch Banking & Trust Company | $60,000 | None Available | |
| Bobick Gary | $200,000 | None Available | |
| Janosky Mark | $120,000 | None Available |
Source: Public Records
Mortgage History
| Date | Status | Borrower | Loan Amount |
|---|---|---|---|
| Open | Cowley Gregory | $204,900 |
Source: Public Records
Tax History Compared to Growth
Tax History
| Year | Tax Paid | Tax Assessment Tax Assessment Total Assessment is a certain percentage of the fair market value that is determined by local assessors to be the total taxable value of land and additions on the property. | Land | Improvement |
|---|---|---|---|---|
| 2025 | $2,430 | $594,520 | $48,000 | $546,520 |
| 2024 | $2,430 | $594,520 | $48,000 | $546,520 |
| 2023 | $2,917 | $594,520 | $48,000 | $546,520 |
| 2022 | $2,917 | $519,570 | $52,000 | $467,570 |
| 2021 | $2,917 | $519,570 | $52,000 | $467,570 |
| 2020 | $2,892 | $519,570 | $52,000 | $467,570 |
| 2019 | $2,892 | $56,080 | $52,000 | $4,080 |
| 2018 | $2,392 | $54,660 | $50,000 | $4,660 |
| 2017 | $2,267 | $54,660 | $50,000 | $4,660 |
| 2016 | $2,165 | $54,660 | $50,000 | $4,660 |
| 2015 | $2,161 | $404,400 | $50,000 | $354,400 |
| 2014 | $453 | $100,000 | $100,000 | $0 |
Source: Public Records
Map
Nearby Homes
- 513 Cliffside Point SW
- 558 Westchester Place SW
- 562 Westchester Place SW
- 538 Lindgrove Place SW
- 597 Lindgrove Place SW
- 564 Lindgrove Place SW
- 526 Lindgrove Place SW
- 5819 England SW
- 6452 Kirkwall Point SW
- 521 Lindgrove Place SW
- 534 Avalon Place
- 6455 Kirkwall Point SW
- 6457 Kirkwall Point SW
- 6591 Castlebrook Way SW
- 6294 Swaison St Unit Lot 116 Ramsey
- 6300 Swainson St SW Unit Lot 117 Beckman
- 503 Cromwell Notch SW
- 6300 Swainson St Unit Lot 117 Beckman
- 6306 Swaison St Unit Lot 118 Newlin
- 6303 Swaison St Unit Lot 109 Littleton
- 504 SW Westchester Place Place SW
- 503 Westchester Place SW
- 503 Westchester Place SW Unit 144
- 507 Westchester Place SW
- 512 Westchester Place SW
- 511 Westchester Place SW
- 515 Westchester Pl L-140
- 515 Westchester Place SW
- 516 Westchester Place SW
- 519 Westchester Place SW
- 6518 Castlebrook Way SW
- 518 Westchester Place SW
- 6522 Castlebrook Way SW Unit 135
- 6522 Castlebrook Way SW
- 357 E 2nd St
- Lot 17 W First St
- 5854 England Point SW
- 5855 England Point (Lot 72)
- 521 Cliffside Point (Lot 123)
- 138 Windsor Circle (Lot 51)