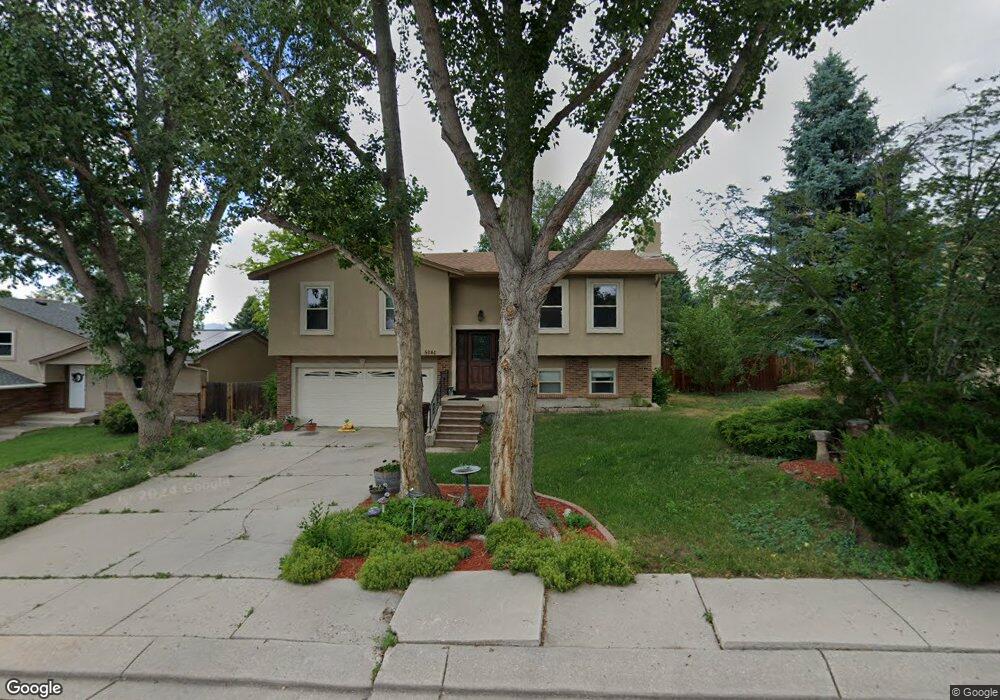
5040 Horseshoe Bend St Colorado Springs, CO 80917
Old Farms NeighborhoodEstimated Value: $395,943 - $419,000
3
Beds
2
Baths
1,144
Sq Ft
$359/Sq Ft
Est. Value
About This Home
This home is located at 5040 Horseshoe Bend St, Colorado Springs, CO 80917 and is currently estimated at $410,236, approximately $358 per square foot. 5040 Horseshoe Bend St is a home located in El Paso County with nearby schools including Scott Elementary School, Jenkins Middle School, and Doherty High School.
Ownership History
Date
Name
Owned For
Owner Type
Purchase Details
Closed on
Apr 27, 2006
Sold by
Stager Max A
Bought by
Crane Felicia R
Current Estimated Value
Home Financials for this Owner
Home Financials are based on the most recent Mortgage that was taken out on this home.
Original Mortgage
$100,000
Outstanding Balance
$57,684
Interest Rate
6.33%
Mortgage Type
Fannie Mae Freddie Mac
Estimated Equity
$352,552
Purchase Details
Closed on
Feb 24, 1998
Sold by
Stager Ann M
Bought by
Stager Max A
Purchase Details
Closed on
May 13, 1994
Sold by
Getreuer Dorothea Emma and Getreuer Kurt Walter
Bought by
Stager Max A and Stager Ann M
Home Financials for this Owner
Home Financials are based on the most recent Mortgage that was taken out on this home.
Original Mortgage
$102,600
Interest Rate
8.4%
Purchase Details
Closed on
Nov 1, 1988
Bought by
Crane Felicia R
Purchase Details
Closed on
Nov 1, 1982
Bought by
Crane Felicia R
Create a Home Valuation Report for This Property
The Home Valuation Report is an in-depth analysis detailing your home's value as well as a comparison with similar homes in the area
Home Values in the Area
Average Home Value in this Area
Purchase History
| Date | Buyer | Sale Price | Title Company |
|---|---|---|---|
| Crane Felicia R | $125,000 | Security Title | |
| Stager Max A | -- | -- | |
| Stager Max A | $108,010 | -- | |
| Crane Felicia R | -- | -- | |
| Crane Felicia R | -- | -- |
Source: Public Records
Mortgage History
| Date | Status | Borrower | Loan Amount |
|---|---|---|---|
| Open | Crane Felicia R | $100,000 | |
| Previous Owner | Stager Max A | $102,600 |
Source: Public Records
Tax History Compared to Growth
Tax History
| Year | Tax Paid | Tax Assessment Tax Assessment Total Assessment is a certain percentage of the fair market value that is determined by local assessors to be the total taxable value of land and additions on the property. | Land | Improvement |
|---|---|---|---|---|
| 2025 | $1,408 | $29,810 | -- | -- |
| 2024 | $1,295 | $29,760 | $5,490 | $24,270 |
| 2023 | $1,295 | $29,760 | $5,490 | $24,270 |
| 2022 | $1,110 | $19,830 | $4,170 | $15,660 |
| 2021 | $1,204 | $20,400 | $4,290 | $16,110 |
| 2020 | $1,026 | $15,120 | $3,720 | $11,400 |
| 2019 | $1,021 | $15,120 | $3,720 | $11,400 |
| 2018 | $950 | $12,950 | $3,240 | $9,710 |
| 2017 | $900 | $12,950 | $3,240 | $9,710 |
| 2016 | $685 | $11,820 | $2,710 | $9,110 |
| 2015 | $683 | $11,820 | $2,710 | $9,110 |
| 2014 | $665 | $11,050 | $2,710 | $8,340 |
Source: Public Records
Map
Nearby Homes
- 4958 Wood Brook Ct
- 4835 W Old Farm Cir
- 5119 Lewisia Point
- 5125 Lewisia Point
- 4878 S Old Brook Cir
- 4966 Galileo Dr
- 5242 Windgate Ct
- 4842 S Old Brook Cir
- 4774 Bunchberry Ln
- 5235 Quasar Ct
- 4955 Chickweed Dr
- 5050 Copernicus Way
- 5081 Willowbrook Rd
- 5485 Castilian Villas Point
- 4636 Winewood Village Dr
- 5441 E Old Farm Cir
- 0 Copper Dr Unit 2206120
- 4671 Winewood Village Dr Unit X4671
- 4652 Excalibur Ct
- 5162 Sunset Ridge Dr
- 5030 Horseshoe Bend St
- 5050 Horseshoe Bend St
- 4760 W Old Farm Cir
- 4750 W Old Farm Cir
- 5060 Horseshoe Bend St
- 5020 Horseshoe Bend St
- 4780 W Old Farm Cir
- 5035 Horseshoe Bend St
- 5045 Horseshoe Bend St
- 4740 W Old Farm Cir
- 5025 Horseshoe Bend St
- 5010 Horseshoe Bend St
- 5055 Horseshoe Bend St
- 4790 W Old Farm Cir
- 4730 W Old Farm Cir
- 5065 Horseshoe Bend St
- 4980 Horseshoe Bend St
- 5025 Farmingdale Dr
- 4765 W Old Farm Cir
- 4810 W Old Farm Cir